OPEN-SOURCE SCRIPT
Moneyball MTF Trend Databox [VinnieTheFish]
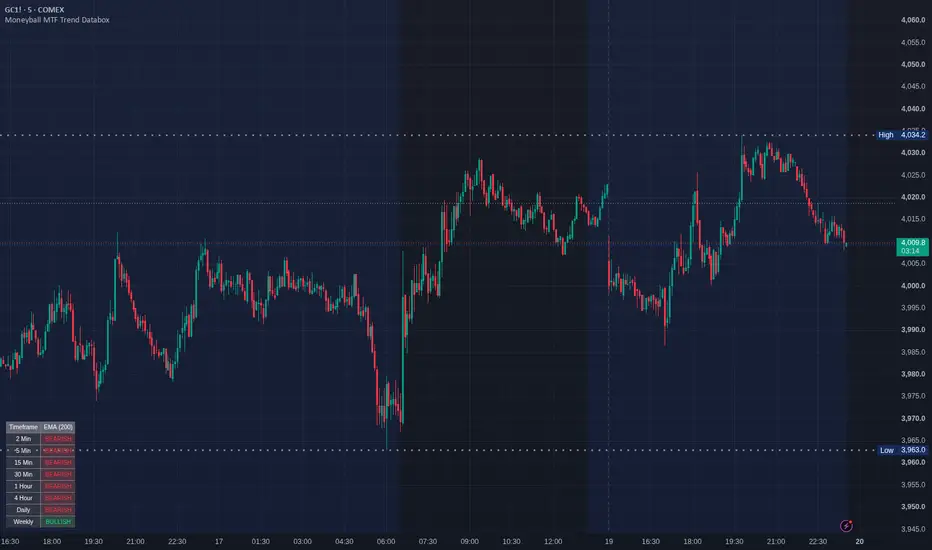
📊 Moneyball MTF Trend Databox [VinnieTheFish]
The Moneyball MTF Trend Databox is a powerful, lightweight companion dashboard designed specifically to complement the core Moneyball EMA-MACD indicator [VinnieTheFish] ecosystem.
When trading with the Moneyball strategy, keeping track of higher and lower timeframe market structures is vital. Instead of manually flipping through charts, this utility aggregates a comprehensive multi-timeframe (MTF) trend analysis across 8 critical timeframes simultaneously and packs them into a clean, customizable HUD directly on your current chart.
🔍 How It Works
The engine dynamically evaluates the current asset’s trend alignment using a single master trend filter of your choice. A timeframe is marked as BULLISH if the price is trading above your selected Moving Average, and BEARISH if it falls below.
By looking at the dashboard, you can instantly see if your lower-timeframe execution aligns with the higher-timeframe "macro" trend.
⚙️ Key Features:
8 Timeframe Coverage: Scans the 2m, 5m, 15m, 30m, 1h, 4h, Daily, and Weekly intervals concurrently.
4-in-1 Trend Filters: Choose your preferred trend line directly from the settings:
SMA (Simple Moving Average)
EMA (Exponential Moving Average)
DEMA (Double EMA - for faster response time)
TEMA (Triple EMA - ultra-low lag trend tracking)
Fully Customizable Display: Position the dashboard anywhere on your chart (Top Right, Bottom Left, etc.) and fine-tune the background opacity so it never obstructs your price action or candlesticks.
Optimized Execution (Pine Script v6): Built natively on TradingView's newest engine version. The table updates strictly on the live bar (barstate.islast), completely protecting your charts from browser lag or slow calculation times.
📈 How to Use This in Your Trading
Macro-Trend Alignment: Before taking a Moneyball buy or sell signal on your execution chart (e.g., the 5-minute), check the Databox. If the 1H, 4H, and Daily rows are screaming BULLISH, you have massive high-probability wind at your back for long positions.
Confluence Clustering: Look for moments when all (or most) timeframes switch to a single color. A full grid alignment often signals a massive breakout or a strong continuation wave.
Counter-Trend Warning: If you see a buy signal on your lower timeframe but the higher timeframes are strictly BEARISH, the dashboard acts as an early warning system to either pass on the trade or take quick, conservative profits.
🛠️ Recommended Setup
For the truest "Moneyball" alignment, set your configuration input to:
MA Length: 200
MA Type: EMA or DEMA
Pair this dashboard on your layout with the primary Moneyball EMA-MACD indicator [VinnieTheFish] oscillator to experience the full synergy of the trend-following system.
The Moneyball MTF Trend Databox is a powerful, lightweight companion dashboard designed specifically to complement the core Moneyball EMA-MACD indicator [VinnieTheFish] ecosystem.
When trading with the Moneyball strategy, keeping track of higher and lower timeframe market structures is vital. Instead of manually flipping through charts, this utility aggregates a comprehensive multi-timeframe (MTF) trend analysis across 8 critical timeframes simultaneously and packs them into a clean, customizable HUD directly on your current chart.
🔍 How It Works
The engine dynamically evaluates the current asset’s trend alignment using a single master trend filter of your choice. A timeframe is marked as BULLISH if the price is trading above your selected Moving Average, and BEARISH if it falls below.
By looking at the dashboard, you can instantly see if your lower-timeframe execution aligns with the higher-timeframe "macro" trend.
⚙️ Key Features:
8 Timeframe Coverage: Scans the 2m, 5m, 15m, 30m, 1h, 4h, Daily, and Weekly intervals concurrently.
4-in-1 Trend Filters: Choose your preferred trend line directly from the settings:
SMA (Simple Moving Average)
EMA (Exponential Moving Average)
DEMA (Double EMA - for faster response time)
TEMA (Triple EMA - ultra-low lag trend tracking)
Fully Customizable Display: Position the dashboard anywhere on your chart (Top Right, Bottom Left, etc.) and fine-tune the background opacity so it never obstructs your price action or candlesticks.
Optimized Execution (Pine Script v6): Built natively on TradingView's newest engine version. The table updates strictly on the live bar (barstate.islast), completely protecting your charts from browser lag or slow calculation times.
📈 How to Use This in Your Trading
Macro-Trend Alignment: Before taking a Moneyball buy or sell signal on your execution chart (e.g., the 5-minute), check the Databox. If the 1H, 4H, and Daily rows are screaming BULLISH, you have massive high-probability wind at your back for long positions.
Confluence Clustering: Look for moments when all (or most) timeframes switch to a single color. A full grid alignment often signals a massive breakout or a strong continuation wave.
Counter-Trend Warning: If you see a buy signal on your lower timeframe but the higher timeframes are strictly BEARISH, the dashboard acts as an early warning system to either pass on the trade or take quick, conservative profits.
🛠️ Recommended Setup
For the truest "Moneyball" alignment, set your configuration input to:
MA Length: 200
MA Type: EMA or DEMA
Pair this dashboard on your layout with the primary Moneyball EMA-MACD indicator [VinnieTheFish] oscillator to experience the full synergy of the trend-following system.
オープンソーススクリプト
TradingViewの精神に則り、このスクリプトの作者はコードをオープンソースとして公開してくれました。トレーダーが内容を確認・検証できるようにという配慮です。作者に拍手を送りましょう!無料で利用できますが、コードの再公開はハウスルールに従う必要があります。

免責事項
これらの情報および投稿は、TradingViewが提供または承認する金融、投資、取引、またはその他の種類の助言もしくは推奨であることを意図したものではなく、またこれらに該当するものでもありません。詳細は利用規約をご覧ください。
オープンソーススクリプト
TradingViewの精神に則り、このスクリプトの作者はコードをオープンソースとして公開してくれました。トレーダーが内容を確認・検証できるようにという配慮です。作者に拍手を送りましょう!無料で利用できますが、コードの再公開はハウスルールに従う必要があります。
免責事項
これらの情報および投稿は、TradingViewが提供または承認する金融、投資、取引、またはその他の種類の助言もしくは推奨であることを意図したものではなく、またこれらに該当するものでもありません。詳細は利用規約をご覧ください。