Midnight Revisit Study | NomadaScalper
Midnight Revisit Study | NomadaScalper
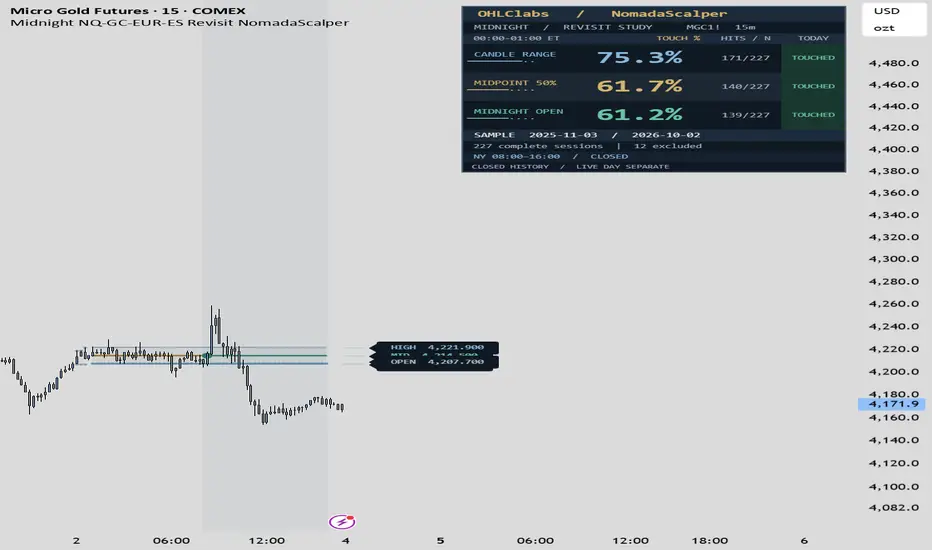
Midnight Revisit Study measures how often price touches three references from the first hour of the New York day during the following daytime session.
It builds the full 00:00 to 01:00 range, then tracks touches between 08:00 and 16:00 on the same date. All times use America/New_York, with automatic daylight saving adjustments.
The dashboard compares three measurements:
• Candle Range: price overlaps any part of the midnight hour’s high-to-low range. Starting inside that range at 08:00 also counts.
• Midpoint 50%: price touches the exact midpoint between the midnight hour’s high and low.
• Midnight Open: price touches the opening price at 00:00.
The midnight structure always represents the entire hour. On a five-minute chart, for example, the indicator builds it from the twelve candles within that hour.
HOW THE STATISTICS WORK
Each eligible date contributes one observation to each measurement. Multiple touches on the same date do not increase the count.
Touch percentage = sessions with a touch / eligible completed sessions × 100.
All three percentages use the same sample. Both the midnight hour and the observation window must have complete, continuous data. Incomplete sessions are excluded, including sessions where a touch occurred before a later data gap.
The main percentages include completed sessions only. Today’s developing status appears separately. Tooltips provide additional information, including hit counts, 95% Wilson intervals and a provisional estimate including today when sufficient data is available.
WHAT APPEARS ON THE CHART
• Midnight High, Low, Midpoint and Open.
• An optional developing range during 00:00 to 01:00.
• Shading for the 08:00 to 16:00 observation window.
• A marker and alert condition for the first confirmed midpoint touch.
• A dashboard showing touch frequencies, sample dates, completed sessions and exclusions.
Display controls include four dashboard sizes, fine scaling, corner positioning, three range styles and adjustable session shading.
SETUP
Use standard time-based charts. Supported minute intervals are 1, 2, 3, 4, 5, 6, 10, 12, 15, 20, 30 and 60.
The indicator supports any symbol with sufficient data in both required windows. Enable the full trading session where available. Markets without midnight data cannot produce an eligible sample. The study currently evaluates Monday through Friday, including when applied to cryptocurrency charts.
By default, calculations use all loaded chart history. The optional date filter restricts that sample; it does not retrieve additional history.
INTERPRETING THE RESULTS
Changing symbols or timeframes recalculates the study. Results may differ because of available history, data feeds, session settings and candle resolution.
Touches are identified from each candle’s high and low. Larger candles can span intrabar price gaps, so an observed touch does not establish an exact transaction time.
These percentages describe historical touch frequency. They are not a strategy win rate or a guarantee that a level will be revisited. The indicator does not model entries, stops, costs or profitability.
Midnight Revisit Study measures how often price touches three references from the first hour of the New York day during the following daytime session.
It builds the full 00:00 to 01:00 range, then tracks touches between 08:00 and 16:00 on the same date. All times use America/New_York, with automatic daylight saving adjustments.
The dashboard compares three measurements:
• Candle Range: price overlaps any part of the midnight hour’s high-to-low range. Starting inside that range at 08:00 also counts.
• Midpoint 50%: price touches the exact midpoint between the midnight hour’s high and low.
• Midnight Open: price touches the opening price at 00:00.
The midnight structure always represents the entire hour. On a five-minute chart, for example, the indicator builds it from the twelve candles within that hour.
HOW THE STATISTICS WORK
Each eligible date contributes one observation to each measurement. Multiple touches on the same date do not increase the count.
Touch percentage = sessions with a touch / eligible completed sessions × 100.
All three percentages use the same sample. Both the midnight hour and the observation window must have complete, continuous data. Incomplete sessions are excluded, including sessions where a touch occurred before a later data gap.
The main percentages include completed sessions only. Today’s developing status appears separately. Tooltips provide additional information, including hit counts, 95% Wilson intervals and a provisional estimate including today when sufficient data is available.
WHAT APPEARS ON THE CHART
• Midnight High, Low, Midpoint and Open.
• An optional developing range during 00:00 to 01:00.
• Shading for the 08:00 to 16:00 observation window.
• A marker and alert condition for the first confirmed midpoint touch.
• A dashboard showing touch frequencies, sample dates, completed sessions and exclusions.
Display controls include four dashboard sizes, fine scaling, corner positioning, three range styles and adjustable session shading.
SETUP
Use standard time-based charts. Supported minute intervals are 1, 2, 3, 4, 5, 6, 10, 12, 15, 20, 30 and 60.
The indicator supports any symbol with sufficient data in both required windows. Enable the full trading session where available. Markets without midnight data cannot produce an eligible sample. The study currently evaluates Monday through Friday, including when applied to cryptocurrency charts.
By default, calculations use all loaded chart history. The optional date filter restricts that sample; it does not retrieve additional history.
INTERPRETING THE RESULTS
Changing symbols or timeframes recalculates the study. Results may differ because of available history, data feeds, session settings and candle resolution.
Touches are identified from each candle’s high and low. Larger candles can span intrabar price gaps, so an observed touch does not establish an exact transaction time.
These percentages describe historical touch frequency. They are not a strategy win rate or a guarantee that a level will be revisited. The indicator does not model entries, stops, costs or profitability.

NomadaScalper
免責事項
これらの情報および投稿は、TradingViewが提供または承認する金融、投資、取引、またはその他の種類の助言もしくは推奨であることを意図したものではなく、またこれらに該当するものでもありません。詳細は利用規約をご覧ください。
NomadaScalper
免責事項
これらの情報および投稿は、TradingViewが提供または承認する金融、投資、取引、またはその他の種類の助言もしくは推奨であることを意図したものではなく、またこれらに該当するものでもありません。詳細は利用規約をご覧ください。