Gideons Gold - ADX Watchman
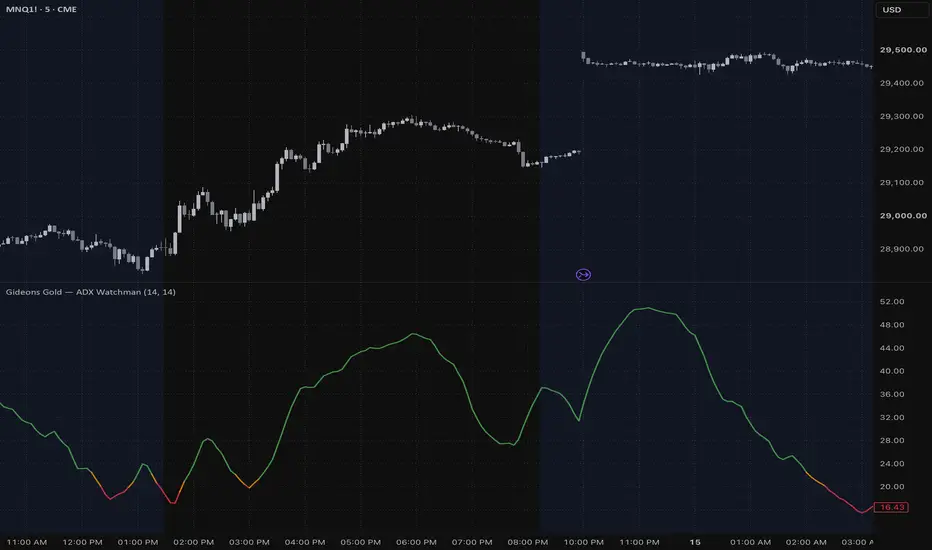
Gideons Gold — ADX Watchman
Meet ADX Watchman, keeping watch on trend strength as part of Gideons Gold. We’re new to the space and want to bring value to the trading community through practical, easy-to-use tools. Our purpose is simple: Less Noise. Greater Focus.
ADX Watchman displays the standard Average Directional Index as a color-coded line, helping you follow changes in trend strength at a glance.
Features:
- Color-coded ADX line for a clear view of trend strength.
- Adjustable ADX smoothing and DI length, both defaulting to 14.
- Timeframe selection to support your chart analysis.
- Open-source code to inspect, learn from, and adapt.
Reading the colors:
- Red — ADX at or below 20: Lower trend strength.
- Yellow — ADX above 20 but below 22: Between the two strength thresholds.
- Green — ADX at or above 22: Higher trend strength relative to those thresholds.
ADX measures strength, not direction. Green can accompany an upward or downward trend. A rising line indicates increasing trend strength; a falling line indicates weakening strength, not necessarily a reversal.
Watchman uses the standard ADX calculation with a simple color treatment. These colors are visual guides, not standalone entry signals. ADX can lag, and its current value can change before the candle closes.
The inspiration behind Gideons Gold
In Judges 7:2–7, God reduced Gideon’s army to 300 so Israel would not credit its own strength for the victory. That story inspires our emphasis on humility, purpose, and the idea that more is not always better—a perspective we bring to clearer charts and focused tools, not a promise of trading success.
Less Noise. Greater Focus.
Clearer charts. Focused tools. A rules-based approach.
Meet ADX Watchman, keeping watch on trend strength as part of Gideons Gold. We’re new to the space and want to bring value to the trading community through practical, easy-to-use tools. Our purpose is simple: Less Noise. Greater Focus.
ADX Watchman displays the standard Average Directional Index as a color-coded line, helping you follow changes in trend strength at a glance.
Features:
- Color-coded ADX line for a clear view of trend strength.
- Adjustable ADX smoothing and DI length, both defaulting to 14.
- Timeframe selection to support your chart analysis.
- Open-source code to inspect, learn from, and adapt.
Reading the colors:
- Red — ADX at or below 20: Lower trend strength.
- Yellow — ADX above 20 but below 22: Between the two strength thresholds.
- Green — ADX at or above 22: Higher trend strength relative to those thresholds.
ADX measures strength, not direction. Green can accompany an upward or downward trend. A rising line indicates increasing trend strength; a falling line indicates weakening strength, not necessarily a reversal.
Watchman uses the standard ADX calculation with a simple color treatment. These colors are visual guides, not standalone entry signals. ADX can lag, and its current value can change before the candle closes.
The inspiration behind Gideons Gold
In Judges 7:2–7, God reduced Gideon’s army to 300 so Israel would not credit its own strength for the victory. That story inspires our emphasis on humility, purpose, and the idea that more is not always better—a perspective we bring to clearer charts and focused tools, not a promise of trading success.
Less Noise. Greater Focus.
Clearer charts. Focused tools. A rules-based approach.

免責事項
これらの情報および投稿は、TradingViewが提供または承認する金融、投資、取引、またはその他の種類の助言もしくは推奨であることを意図したものではなく、またこれらに該当するものでもありません。詳細は利用規約をご覧ください。
免責事項
これらの情報および投稿は、TradingViewが提供または承認する金融、投資、取引、またはその他の種類の助言もしくは推奨であることを意図したものではなく、またこれらに該当するものでもありません。詳細は利用規約をご覧ください。