OPEN-SOURCE SCRIPT
Double Tap 3D Indicator [Neblok]
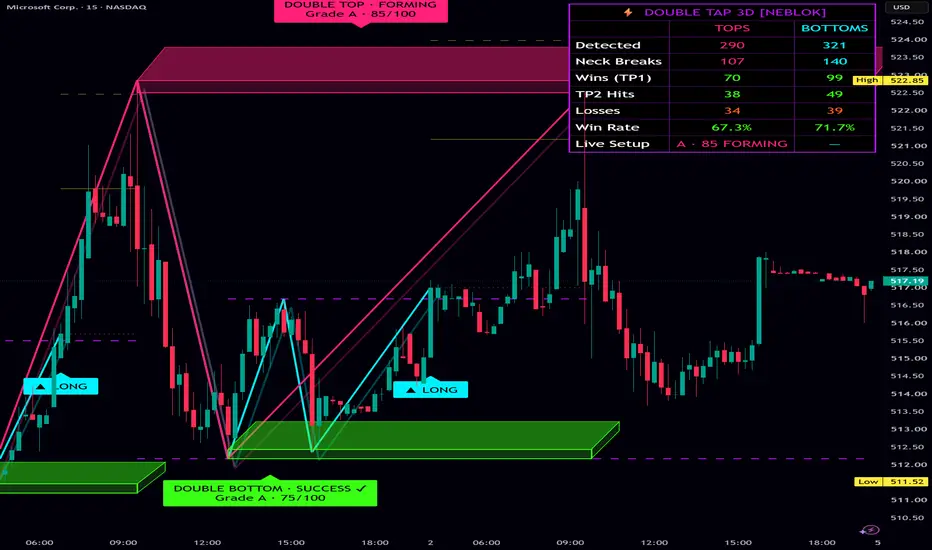
DOUBLE TAP 3D INDICATOR [NEBLOK]
Double Tap 3D finds Double Tops and Double Bottoms automatically, grades every pattern from 0 to 100, draws measured-move targets, labels LONG / SHORT signals when the neckline breaks, and tracks whether each pattern actually reached its target or failed. Everything is drawn with 3D extruded zones, neon colors and large, easy-to-read labels.
WHAT IS A DOUBLE TOP / DOUBLE BOTTOM?
A Double Top is an "M" shape. Price rallies to a high, pulls back, rallies to roughly the same high again, then fails. The low between the two peaks is the neckline. A close below the neckline signals that buyers have lost control.
A Double Bottom is the mirror image, a "W" shape. Two lows at roughly the same level with a neckline high between them. A close above the neckline signals that sellers have lost control.
HOW THE INDICATOR FINDS PATTERNS
1. It tracks confirmed swing highs and swing lows using pivot points.
2. When a new swing forms, it compares it to the last several swings on the same side, not just the most recent one. This catches valid patterns even when a minor swing sits between the two peaks.
3. The two peaks must be within an ATR-based tolerance of each other, and no higher high (or lower low) can sit between them.
4. The pattern must be tall enough, measured in ATR, to filter out noise.
5. It then maps the full structure: the prior trend leg, peak 1, the neckline, and peak 2.
Because tolerance and height are measured in ATR, the same settings adapt to any symbol and timeframe, from futures and stocks to crypto and forex.
THE QUALITY SCORE (0–100)
Every pattern is graded on six factors:
- Peak Match (25 pts): How closely the two peaks line up.
- RSI Divergence (20 pts): Weaker momentum on the second peak.
- Volume Divergence (15 pts): Less participation on the second peak. Symbols without volume get a neutral half score.
- Pattern Height (15 pts): Bigger patterns relative to ATR score higher.
- Symmetry (10 pts): How balanced the two legs of the pattern are.
- Prior Trend (15 pts): The size of the move leading into the pattern. A reversal needs something to reverse.
Grades:
- A = 75 and above
- B = 55 to 74
- C = below 55
Hover over any pattern label to see its full score breakdown.
PATTERN LIFECYCLE
Each pattern's label updates as it plays out:
- FORMING: Both peaks are in place. Waiting for a neckline break.
- ACTIVE: Price closed through the neckline.
- TP1 HIT ✔: The first target was reached.
- SUCCESS ✔: TP1 was reached and price later returned to the breakeven level.
- TP2 HIT ✔✔: The extended target was reached.
- FAILED ✖: The stop was hit before TP1.
- TIMED OUT: The pattern broke but never resolved within the allowed time.
A forming pattern is removed if price runs beyond the peaks (stop level) before breaking the neckline, or if it doesn't break the neckline within the allowed number of bars.
SIGNALS
When a candle closes through the neckline, the break is labeled:
- ▼ SHORT / ▲ LONG: The break passed your minimum quality score and any filters you turned on.
- ▼ BREAK / ▲ BREAK: The neckline broke, but the pattern didn't meet your score or filter requirements.
Signals require a closed candle, so they do not repaint.
TARGETS AND STOPS
- TP1: Measured move from the neckline, 1.0× pattern height by default.
- TP2: Extended measured move, 1.618× pattern height by default.
- SL: Just beyond the peaks, plus an ATR buffer.
- BE: With breakeven tracking on, the SL line moves to the break price once TP1 is hit.
Live patterns show price tags for TP1, TP2 and SL. When a pattern finishes, its tags are removed and its lines are dimmed to keep the chart readable.
DASHBOARD
The on-chart table shows, separately for tops and bottoms:
- Detected: Patterns found.
- Neck Breaks: Patterns that broke the neckline.
- Wins (TP1): Breaks that reached TP1 before the stop.
- TP2 Hits: Breaks that went on to TP2.
- Losses: Breaks that hit the stop before TP1.
- Win Rate: Wins ÷ (Wins + Losses). Timeouts are excluded.
- Live Setup: The grade and stage of the current live pattern, if any.
The win rate covers the history loaded on your chart for that symbol and timeframe. Use it to judge how well patterns behave on what you trade.
HOW TO USE IT
1. Add the indicator to your chart. Timeframes from 15m to 4h tend to produce the cleanest swings, but it works on any timeframe.
2. Watch FORMING patterns. These are setups, not signals yet. Mark the neckline and plan your trade.
3. Wait for a candle close through the neckline. That is the trigger.
4. Use the grade. A-grade patterns have the most supporting evidence. Raise "Min Quality Score for Signals" so only stronger setups get LONG / SHORT labels.
5. Check the dashboard. If the win rate is weak on your symbol and timeframe, adjust the pivot settings or raise the minimum score.
6. Manage the trade with the drawn levels: SL beyond the peaks, partial profits at TP1, runner to TP2.
7. Combine with your own analysis. Patterns that form at major support/resistance, higher-timeframe levels, or after extended trends tend to be more meaningful.
SETTINGS GUIDE
Detection
- Detect Double Tops / Bottoms: Turn either side on or off.
- Pivot Left / Right Bars: Size of the swings used. Higher values find larger, cleaner patterns but confirm later.
- Peak Match Tolerance (× ATR): How close the two peaks must be.
- Min / Max Bars Between Peaks: Pattern width limits.
- Min Pattern Height (× ATR): Filters out small, noisy patterns.
- Bars Allowed to Break Neckline: How long a forming pattern stays valid.
- Prior Trend Lookback: How far back to measure the trend leading into the pattern.
- ATR Length: ATR period used throughout.
Quality & Filters
- Min Quality Score for Signals: Minimum score for a break to be labeled LONG / SHORT.
- Draw Patterns Below Min Score: Show or hide lower-grade patterns.
- RSI Length: Used for divergence scoring.
- Trend Filter (EMA): SHORT signals need the break below the EMA, LONG signals above it. The EMA is plotted when this is on.
- Require Volume Surge on Break: The break candle's volume must exceed the 20-bar average by your multiplier.
Targets & Risk
- Stop Buffer Beyond Peaks (× ATR): Distance of the SL beyond the peaks. Also used as the invalidation level for forming patterns.
- TP1 / TP2 (× Pattern Height): Measured-move target multipliers.
- Show TP / SL Lines: Turn target lines on or off.
Signals
- LONG / SHORT Signals: Enable or disable each direction.
- Track Stop at Breakeven After TP1: Moves the SL line to the break price after TP1.
Visuals
- Colors: Customize every neon color.
- 3D Extruded Zones & Shadowed Legs: Turn the 3D effect on or off.
- 3D Depth (Bars / × ATR): How deep the 3D extrusion looks.
- Label Size: Normal, Large or Huge.
- Pattern Line Width: Thickness of the M / W lines.
- Completed Patterns to Keep: How many finished patterns stay on the chart.
- Keep TP / SL Tags on Finished Patterns: Keep price tags on completed patterns. Off by default to reduce clutter.
Dashboard
- Show Dashboard, Position and Text Size.
ALERTS
Option A: Create an alert and choose "Any alert() function call". You'll get every event in one alert, with the grade, neckline, SL, TP1 and TP2 included.
Option B: Choose a single condition:
- Double Top Forming
- Double Bottom Forming
- SHORT Signal
- LONG Signal
- Any Neckline Break
- TP1 Hit
- TP2 Hit
- Pattern Failed
Set alerts to trigger "Once Per Bar Close" to match the indicator's confirmed-close logic.
IMPORTANT NOTES
- No repainting: Swings are only used after they're confirmed, and breaks require a closed candle. Because of this, patterns appear a few bars after the second peak (equal to "Pivot Right Bars"). This is by design.
- If a stop and a target are both touched within the same bar, the indicator counts it as a stop. This is the conservative assumption, since the order of intrabar moves is unknown.
- Dashboard statistics depend on how much history is loaded and are not a backtest. They don't include commissions, slippage or position sizing.
- No pattern works every time. The quality score improves the odds of selecting stronger setups but does not guarantee results.
DISCLAIMER
This indicator is provided for educational and informational purposes only. It is not financial advice, investment advice, or a recommendation to buy or sell any security, futures contract, cryptocurrency, or other financial instrument.
Trading involves substantial risk of loss and is not suitable for every investor. You can lose more than your initial investment when trading leveraged products such as futures, options, and forex. Past performance, including historical pattern statistics shown by this indicator, does not guarantee future results.
All trading decisions are your own. Always do your own research, use proper risk management, and consider consulting a licensed financial professional before making any trading decisions. The author is not responsible for any losses incurred from the use of this indicator.
Double Tap 3D finds Double Tops and Double Bottoms automatically, grades every pattern from 0 to 100, draws measured-move targets, labels LONG / SHORT signals when the neckline breaks, and tracks whether each pattern actually reached its target or failed. Everything is drawn with 3D extruded zones, neon colors and large, easy-to-read labels.
WHAT IS A DOUBLE TOP / DOUBLE BOTTOM?
A Double Top is an "M" shape. Price rallies to a high, pulls back, rallies to roughly the same high again, then fails. The low between the two peaks is the neckline. A close below the neckline signals that buyers have lost control.
A Double Bottom is the mirror image, a "W" shape. Two lows at roughly the same level with a neckline high between them. A close above the neckline signals that sellers have lost control.
HOW THE INDICATOR FINDS PATTERNS
1. It tracks confirmed swing highs and swing lows using pivot points.
2. When a new swing forms, it compares it to the last several swings on the same side, not just the most recent one. This catches valid patterns even when a minor swing sits between the two peaks.
3. The two peaks must be within an ATR-based tolerance of each other, and no higher high (or lower low) can sit between them.
4. The pattern must be tall enough, measured in ATR, to filter out noise.
5. It then maps the full structure: the prior trend leg, peak 1, the neckline, and peak 2.
Because tolerance and height are measured in ATR, the same settings adapt to any symbol and timeframe, from futures and stocks to crypto and forex.
THE QUALITY SCORE (0–100)
Every pattern is graded on six factors:
- Peak Match (25 pts): How closely the two peaks line up.
- RSI Divergence (20 pts): Weaker momentum on the second peak.
- Volume Divergence (15 pts): Less participation on the second peak. Symbols without volume get a neutral half score.
- Pattern Height (15 pts): Bigger patterns relative to ATR score higher.
- Symmetry (10 pts): How balanced the two legs of the pattern are.
- Prior Trend (15 pts): The size of the move leading into the pattern. A reversal needs something to reverse.
Grades:
- A = 75 and above
- B = 55 to 74
- C = below 55
Hover over any pattern label to see its full score breakdown.
PATTERN LIFECYCLE
Each pattern's label updates as it plays out:
- FORMING: Both peaks are in place. Waiting for a neckline break.
- ACTIVE: Price closed through the neckline.
- TP1 HIT ✔: The first target was reached.
- SUCCESS ✔: TP1 was reached and price later returned to the breakeven level.
- TP2 HIT ✔✔: The extended target was reached.
- FAILED ✖: The stop was hit before TP1.
- TIMED OUT: The pattern broke but never resolved within the allowed time.
A forming pattern is removed if price runs beyond the peaks (stop level) before breaking the neckline, or if it doesn't break the neckline within the allowed number of bars.
SIGNALS
When a candle closes through the neckline, the break is labeled:
- ▼ SHORT / ▲ LONG: The break passed your minimum quality score and any filters you turned on.
- ▼ BREAK / ▲ BREAK: The neckline broke, but the pattern didn't meet your score or filter requirements.
Signals require a closed candle, so they do not repaint.
TARGETS AND STOPS
- TP1: Measured move from the neckline, 1.0× pattern height by default.
- TP2: Extended measured move, 1.618× pattern height by default.
- SL: Just beyond the peaks, plus an ATR buffer.
- BE: With breakeven tracking on, the SL line moves to the break price once TP1 is hit.
Live patterns show price tags for TP1, TP2 and SL. When a pattern finishes, its tags are removed and its lines are dimmed to keep the chart readable.
DASHBOARD
The on-chart table shows, separately for tops and bottoms:
- Detected: Patterns found.
- Neck Breaks: Patterns that broke the neckline.
- Wins (TP1): Breaks that reached TP1 before the stop.
- TP2 Hits: Breaks that went on to TP2.
- Losses: Breaks that hit the stop before TP1.
- Win Rate: Wins ÷ (Wins + Losses). Timeouts are excluded.
- Live Setup: The grade and stage of the current live pattern, if any.
The win rate covers the history loaded on your chart for that symbol and timeframe. Use it to judge how well patterns behave on what you trade.
HOW TO USE IT
1. Add the indicator to your chart. Timeframes from 15m to 4h tend to produce the cleanest swings, but it works on any timeframe.
2. Watch FORMING patterns. These are setups, not signals yet. Mark the neckline and plan your trade.
3. Wait for a candle close through the neckline. That is the trigger.
4. Use the grade. A-grade patterns have the most supporting evidence. Raise "Min Quality Score for Signals" so only stronger setups get LONG / SHORT labels.
5. Check the dashboard. If the win rate is weak on your symbol and timeframe, adjust the pivot settings or raise the minimum score.
6. Manage the trade with the drawn levels: SL beyond the peaks, partial profits at TP1, runner to TP2.
7. Combine with your own analysis. Patterns that form at major support/resistance, higher-timeframe levels, or after extended trends tend to be more meaningful.
SETTINGS GUIDE
Detection
- Detect Double Tops / Bottoms: Turn either side on or off.
- Pivot Left / Right Bars: Size of the swings used. Higher values find larger, cleaner patterns but confirm later.
- Peak Match Tolerance (× ATR): How close the two peaks must be.
- Min / Max Bars Between Peaks: Pattern width limits.
- Min Pattern Height (× ATR): Filters out small, noisy patterns.
- Bars Allowed to Break Neckline: How long a forming pattern stays valid.
- Prior Trend Lookback: How far back to measure the trend leading into the pattern.
- ATR Length: ATR period used throughout.
Quality & Filters
- Min Quality Score for Signals: Minimum score for a break to be labeled LONG / SHORT.
- Draw Patterns Below Min Score: Show or hide lower-grade patterns.
- RSI Length: Used for divergence scoring.
- Trend Filter (EMA): SHORT signals need the break below the EMA, LONG signals above it. The EMA is plotted when this is on.
- Require Volume Surge on Break: The break candle's volume must exceed the 20-bar average by your multiplier.
Targets & Risk
- Stop Buffer Beyond Peaks (× ATR): Distance of the SL beyond the peaks. Also used as the invalidation level for forming patterns.
- TP1 / TP2 (× Pattern Height): Measured-move target multipliers.
- Show TP / SL Lines: Turn target lines on or off.
Signals
- LONG / SHORT Signals: Enable or disable each direction.
- Track Stop at Breakeven After TP1: Moves the SL line to the break price after TP1.
Visuals
- Colors: Customize every neon color.
- 3D Extruded Zones & Shadowed Legs: Turn the 3D effect on or off.
- 3D Depth (Bars / × ATR): How deep the 3D extrusion looks.
- Label Size: Normal, Large or Huge.
- Pattern Line Width: Thickness of the M / W lines.
- Completed Patterns to Keep: How many finished patterns stay on the chart.
- Keep TP / SL Tags on Finished Patterns: Keep price tags on completed patterns. Off by default to reduce clutter.
Dashboard
- Show Dashboard, Position and Text Size.
ALERTS
Option A: Create an alert and choose "Any alert() function call". You'll get every event in one alert, with the grade, neckline, SL, TP1 and TP2 included.
Option B: Choose a single condition:
- Double Top Forming
- Double Bottom Forming
- SHORT Signal
- LONG Signal
- Any Neckline Break
- TP1 Hit
- TP2 Hit
- Pattern Failed
Set alerts to trigger "Once Per Bar Close" to match the indicator's confirmed-close logic.
IMPORTANT NOTES
- No repainting: Swings are only used after they're confirmed, and breaks require a closed candle. Because of this, patterns appear a few bars after the second peak (equal to "Pivot Right Bars"). This is by design.
- If a stop and a target are both touched within the same bar, the indicator counts it as a stop. This is the conservative assumption, since the order of intrabar moves is unknown.
- Dashboard statistics depend on how much history is loaded and are not a backtest. They don't include commissions, slippage or position sizing.
- No pattern works every time. The quality score improves the odds of selecting stronger setups but does not guarantee results.
DISCLAIMER
This indicator is provided for educational and informational purposes only. It is not financial advice, investment advice, or a recommendation to buy or sell any security, futures contract, cryptocurrency, or other financial instrument.
Trading involves substantial risk of loss and is not suitable for every investor. You can lose more than your initial investment when trading leveraged products such as futures, options, and forex. Past performance, including historical pattern statistics shown by this indicator, does not guarantee future results.
All trading decisions are your own. Always do your own research, use proper risk management, and consider consulting a licensed financial professional before making any trading decisions. The author is not responsible for any losses incurred from the use of this indicator.
オープンソーススクリプト
TradingViewの精神に則り、このスクリプトの作者はコードをオープンソースとして公開してくれました。トレーダーが内容を確認・検証できるようにという配慮です。作者に拍手を送りましょう!無料で利用できますが、コードの再公開はハウスルールに従う必要があります。

免責事項
これらの情報および投稿は、TradingViewが提供または承認する金融、投資、取引、またはその他の種類の助言もしくは推奨であることを意図したものではなく、またこれらに該当するものでもありません。詳細は利用規約をご覧ください。
オープンソーススクリプト
TradingViewの精神に則り、このスクリプトの作者はコードをオープンソースとして公開してくれました。トレーダーが内容を確認・検証できるようにという配慮です。作者に拍手を送りましょう!無料で利用できますが、コードの再公開はハウスルールに従う必要があります。
免責事項
これらの情報および投稿は、TradingViewが提供または承認する金融、投資、取引、またはその他の種類の助言もしくは推奨であることを意図したものではなく、またこれらに該当するものでもありません。詳細は利用規約をご覧ください。