OPEN-SOURCE SCRIPT
更新済 Triangle Pattern Detection [Dots3Red]
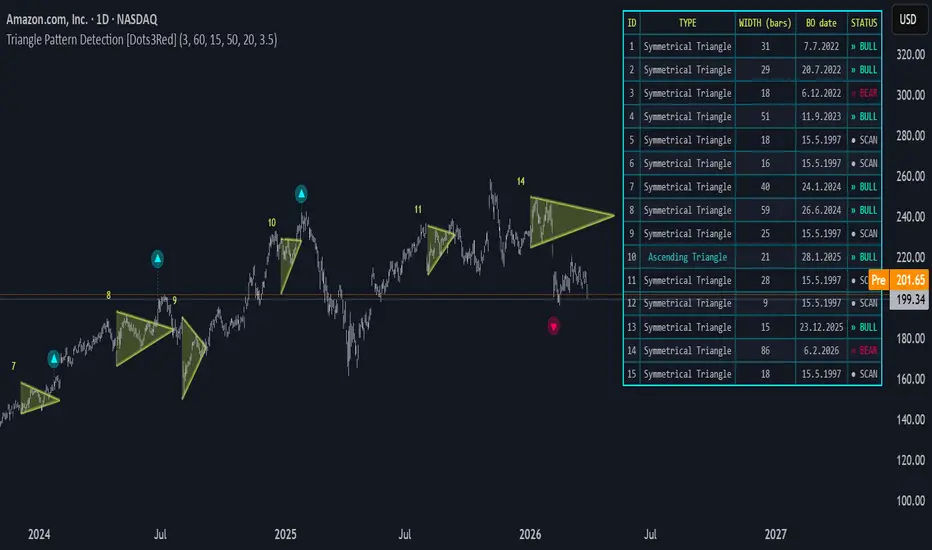
Triangle Pattern Detection Indicator detects and draws triangle chart patterns in real time. The indicator identifies pivot highs and lows, validates converging trendlines, calculates the mathematical apex, and classifies each pattern by type.
How it works
The indicator scans for pivot highs and pivot lows using a configurable lookback length. Once two valid pivot highs and two valid pivot lows are found, it verifies that:
If all conditions pass, the apex is calculated mathematically as the exact intersection point of the two trendlines, and the full triangle is drawn from the shared start bar to the apex.
Pattern Types Detected
Visuals
Info Table (top right)
Keeps a record of the last 5 detected triangles showing:
Column - Description
The Status column updates on every bar so you can see in real time whether price has broken out of any recent pattern.
Settings
Notes
Example on BTC 🪙 chart

How it works
The indicator scans for pivot highs and pivot lows using a configurable lookback length. Once two valid pivot highs and two valid pivot lows are found, it verifies that:
- The trendlines are genuinely converging (spread shrinks from left to right)
- No bar between the pivots violates the trendline boundary
- The upper and lower patterns are aligned in time
- The pattern meets minimum and maximum width requirements
If all conditions pass, the apex is calculated mathematically as the exact intersection point of the two trendlines, and the full triangle is drawn from the shared start bar to the apex.
Pattern Types Detected
- Symmetrical Triangle — both lines converging toward each other
- Ascending Triangle — flat upper resistance, rising lower support
- Descending Triangle — declining upper resistance, flat lower support
- Rectangle — both lines near horizontal
Visuals
- 🟡 Electric glow triangle
- ▼ / ▲ Pivot markers at pattern boundaries (commented out in the code)
- 🔵 Bullish breakout signal / 🔴 Bearish breakout signal with glow effect and stem line
- Number label at each triangle's start for cross-referencing with the info table
Info Table (top right)
Keeps a record of the last 5 detected triangles showing:
Column - Description
- ID - Triangle number
- Type- Pattern classification
- Width - Pattern width in bars
- BO date - The day the price broke out from the triangle pattern
- Status - Live breakout status — Bull / Bear / Inside
The Status column updates on every bar so you can see in real time whether price has broken out of any recent pattern.
Settings
- Pivot Length - Sensitivity of pivot detection (1–10). Lower = more patterns
- Max Pattern Width - Maximum bars between first and second pivots
- Start Bar Alignment Tolerance - Max distance between the start of the upper and lower pivots of the triangle's sides
- Max Apex Distance - How far ahead the apex can project
- Min Pattern Width - Filters out patterns that are too narrow to be meaningful
- Breakout Threshold % - How far the price must close beyond the trendline to confirm a breakout
Notes
- All triangles are drawn on the last bar only, avoiding repainting of historical patterns
- Breakout detection scans from the leftmost bar of the pattern to the apex, firing on the first confirmed close beyond the boundary
Example on BTC 🪙 chart
リリースノート
minor changesリリースノート
...オープンソーススクリプト
TradingViewの精神に則り、このスクリプトの作者はコードをオープンソースとして公開してくれました。トレーダーが内容を確認・検証できるようにという配慮です。作者に拍手を送りましょう!無料で利用できますが、コードの再公開はハウスルールに従う必要があります。

Connect the dots to elevate your trading.
免責事項
これらの情報および投稿は、TradingViewが提供または承認する金融、投資、取引、またはその他の種類の助言もしくは推奨であることを意図したものではなく、またこれらに該当するものでもありません。詳細は利用規約をご覧ください。
オープンソーススクリプト
TradingViewの精神に則り、このスクリプトの作者はコードをオープンソースとして公開してくれました。トレーダーが内容を確認・検証できるようにという配慮です。作者に拍手を送りましょう!無料で利用できますが、コードの再公開はハウスルールに従う必要があります。
Connect the dots to elevate your trading.
免責事項
これらの情報および投稿は、TradingViewが提供または承認する金融、投資、取引、またはその他の種類の助言もしくは推奨であることを意図したものではなく、またこれらに該当するものでもありません。詳細は利用規約をご覧ください。