アップデート済
Trend or Range Widget [D4A]
Trend or Range Widget
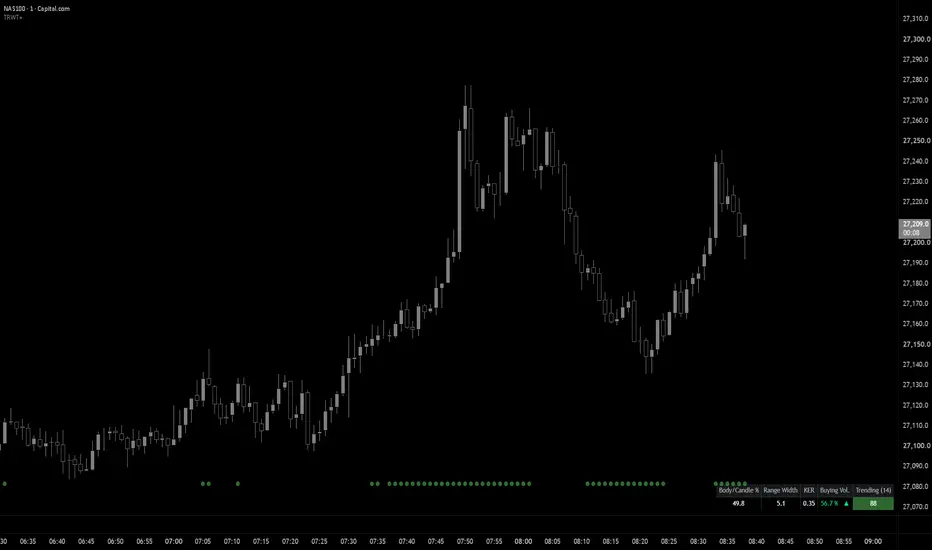
The script purpose is to help establish whether we are in trending or ranging market conditions. Based on user defined lookback input, the script calculates score and attributes market conditions based on the score. The score is made up of three main components:
1. Average ratio of candle body to whole candle size, here called "body/candle %". The logic is that if the number is raising then on average the candles have bigger bodies than wicks and as a result the market moves with more conviction, which may be attributed to a trending conditions. When average body/candle ratio is declining - this means the market direction is less decisive (potentially ranging).
2. Range width - ATR based size of current range, which is calculated using the highest and lowest point in given period. The bigger the range - the bigger the recent move is, indicating the market is trying to move in certain direction.
3. KER - Kaufman's Efficiency Ratio - calculated by dividing the price change over given period by the absolute sum of the price movements that occurred to achieve that change. The resulting ratio ranges between 0 and 1 with higher values representing a more efficient or trending market.
The final score is derived by multiplication of above variables and result is presented as a number which is then attributed to either ranging conditions (score < 25) or trending conditions (score > 50). Anything between 25 and 50 is considered "in between" or neutral. The user can set both thresholds to satisfy their own understanding of market behaviour of the asset they are trading. This requires observation and experience, hence this script may be not suitable for beginner traders.
The script is intended to be used as mere addition and not to be used on its own as there are many other factors not considered by the script which should be taken into account when evaluating market conditions, eg. any nearby support / resistance levels, liquidity levels, time of day, news events, etc..
Note that the script doesn't indicate which direction the market may be moving (bullish or bearish). This needs to be established by the trader based on other factors.
Additional features
- The script displays currently traded volume information which can be helpful in gauging the prevailing buying or selling pressure. The triangle markers indicate raising (▲) or falling (▼) volume type. Note, that the volume is not used in calculation of the main score.
- Most of calculated values are displayed in small widget, which can be reduced to display only one column or one number if necessary.
- The script is able to display visual markers on the chart to indicate trending or ranging values of the score (disabled by default).
SETTINGS
- Lookback - user input to define the range used for calculations
- Trending threshold - user input (and color) to mark trending conditions (market is trending when the score is above the threshold)
- Neutral - define neutral color when the score is between trending and ranging
- Ranging threshold - user input (and color) to define ranging market conditions (market is ranging when the score is below the threshold)
- Show Only the Score - only the last column/row in the widget is displayed
- Minimal - only the score is displayed
- Widget Orientation & Location - define orientation and location of the widget on the chart
- Text colors / Size / Header BG - header and main text colors and size of text, header background can be customized
- Show Markers - display trend/range markers on the chart
- Trend Only - display only trend markers
The script should work on all asset types and all timeframes, but it is probably the most useful on lower timeframes, like 1m or 5m.
-----------------
Disclaimer
The content provided in this script is for educational and informational purposes only. It does not constitute financial advice, investment recommendations, or a solicitation to buy or sell any financial instruments. I will not accept liability for any loss or damage, including without limitation any loss of profit, which may arise directly or indirectly from the use of or reliance on such information.
All investments involve risk, and the past performance of a security, industry, sector, market, financial product, trading strategy, backtest, or individual's trading does not guarantee future results or returns. Investors are fully responsible for any investment decisions they make. Such decisions should be based solely on an evaluation of their financial circumstances, investment objectives, risk tolerance, and liquidity needs.
The script purpose is to help establish whether we are in trending or ranging market conditions. Based on user defined lookback input, the script calculates score and attributes market conditions based on the score. The score is made up of three main components:
1. Average ratio of candle body to whole candle size, here called "body/candle %". The logic is that if the number is raising then on average the candles have bigger bodies than wicks and as a result the market moves with more conviction, which may be attributed to a trending conditions. When average body/candle ratio is declining - this means the market direction is less decisive (potentially ranging).
2. Range width - ATR based size of current range, which is calculated using the highest and lowest point in given period. The bigger the range - the bigger the recent move is, indicating the market is trying to move in certain direction.
3. KER - Kaufman's Efficiency Ratio - calculated by dividing the price change over given period by the absolute sum of the price movements that occurred to achieve that change. The resulting ratio ranges between 0 and 1 with higher values representing a more efficient or trending market.
The final score is derived by multiplication of above variables and result is presented as a number which is then attributed to either ranging conditions (score < 25) or trending conditions (score > 50). Anything between 25 and 50 is considered "in between" or neutral. The user can set both thresholds to satisfy their own understanding of market behaviour of the asset they are trading. This requires observation and experience, hence this script may be not suitable for beginner traders.
The script is intended to be used as mere addition and not to be used on its own as there are many other factors not considered by the script which should be taken into account when evaluating market conditions, eg. any nearby support / resistance levels, liquidity levels, time of day, news events, etc..
Note that the script doesn't indicate which direction the market may be moving (bullish or bearish). This needs to be established by the trader based on other factors.
Additional features
- The script displays currently traded volume information which can be helpful in gauging the prevailing buying or selling pressure. The triangle markers indicate raising (▲) or falling (▼) volume type. Note, that the volume is not used in calculation of the main score.
- Most of calculated values are displayed in small widget, which can be reduced to display only one column or one number if necessary.
- The script is able to display visual markers on the chart to indicate trending or ranging values of the score (disabled by default).
SETTINGS
- Lookback - user input to define the range used for calculations
- Trending threshold - user input (and color) to mark trending conditions (market is trending when the score is above the threshold)
- Neutral - define neutral color when the score is between trending and ranging
- Ranging threshold - user input (and color) to define ranging market conditions (market is ranging when the score is below the threshold)
- Show Only the Score - only the last column/row in the widget is displayed
- Minimal - only the score is displayed
- Widget Orientation & Location - define orientation and location of the widget on the chart
- Text colors / Size / Header BG - header and main text colors and size of text, header background can be customized
- Show Markers - display trend/range markers on the chart
- Trend Only - display only trend markers
The script should work on all asset types and all timeframes, but it is probably the most useful on lower timeframes, like 1m or 5m.
-----------------
Disclaimer
The content provided in this script is for educational and informational purposes only. It does not constitute financial advice, investment recommendations, or a solicitation to buy or sell any financial instruments. I will not accept liability for any loss or damage, including without limitation any loss of profit, which may arise directly or indirectly from the use of or reliance on such information.
All investments involve risk, and the past performance of a security, industry, sector, market, financial product, trading strategy, backtest, or individual's trading does not guarantee future results or returns. Investors are fully responsible for any investment decisions they make. Such decisions should be based solely on an evaluation of their financial circumstances, investment objectives, risk tolerance, and liquidity needs.
リリースノート
Small bug fix in how the script displays volume information.
免責事項
これらの情報および投稿は、TradingViewが提供または承認する金融、投資、取引、またはその他の種類の助言もしくは推奨であることを意図したものではなく、またこれらに該当するものでもありません。詳細は利用規約をご覧ください。
免責事項
これらの情報および投稿は、TradingViewが提供または承認する金融、投資、取引、またはその他の種類の助言もしくは推奨であることを意図したものではなく、またこれらに該当するものでもありません。詳細は利用規約をご覧ください。