ICT Swing Structure [STL/STH/ ITL/ITH /LTL/LTH]
ICT Swing Structure [STL/STH · ITL/ITH · LTL/LTH]
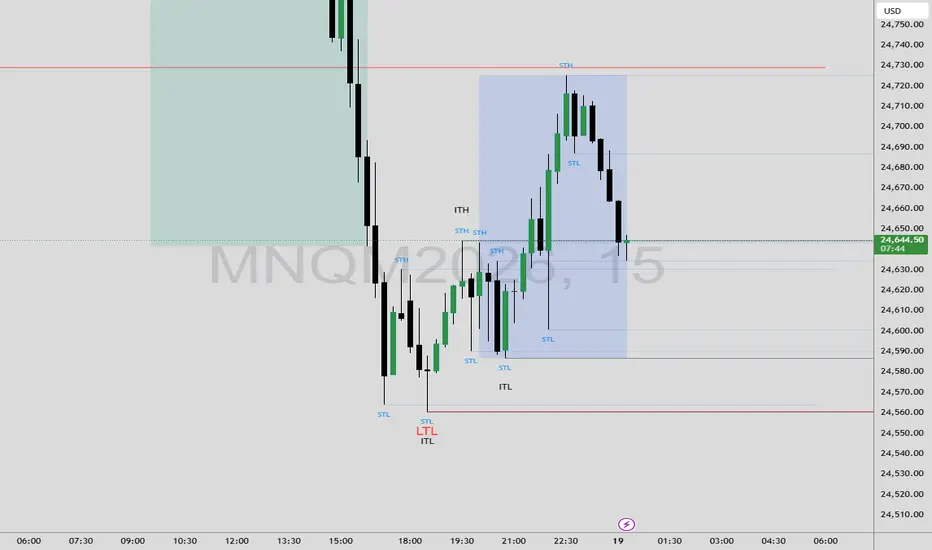
This indicator automatically identifies and labels the three degrees of market structure as taught in the ICT (Inner Circle Trader) 2022 Mentorship — Short-Term, Intermediate-Term, and Long-Term swing highs and lows.
Price swings are classified into a nested hierarchy:
STH / STL — Short-Term Highs and Lows, the most frequent pivots on any timeframe
ITH / ITL — Intermediate-Term Highs and Lows, formed when a short-term swing is confirmed by surrounding short-term pivots on both sides
LTH / LTL — Long-Term Highs and Lows, the most significant turning points requiring intermediate-term confirmation on both sides
Each degree is displayed with a distinct color-coded label and a horizontal reference line extending forward from the swing point. Line lengths are scaled to significance — ST levels extend the shortest distance, LT levels the longest — keeping the chart clean while highlighting what matters most.
Fully customizable with toggles for each degree, adjustable pivot sensitivity, and individual color controls for ST, IT, and LT levels.
Best used as part of a top-down analysis workflow to define HTF bias, identify liquidity pools, and frame precision entries across all asset classes and timeframes.
This indicator automatically identifies and labels the three degrees of market structure as taught in the ICT (Inner Circle Trader) 2022 Mentorship — Short-Term, Intermediate-Term, and Long-Term swing highs and lows.
Price swings are classified into a nested hierarchy:
STH / STL — Short-Term Highs and Lows, the most frequent pivots on any timeframe
ITH / ITL — Intermediate-Term Highs and Lows, formed when a short-term swing is confirmed by surrounding short-term pivots on both sides
LTH / LTL — Long-Term Highs and Lows, the most significant turning points requiring intermediate-term confirmation on both sides
Each degree is displayed with a distinct color-coded label and a horizontal reference line extending forward from the swing point. Line lengths are scaled to significance — ST levels extend the shortest distance, LT levels the longest — keeping the chart clean while highlighting what matters most.
Fully customizable with toggles for each degree, adjustable pivot sensitivity, and individual color controls for ST, IT, and LT levels.
Best used as part of a top-down analysis workflow to define HTF bias, identify liquidity pools, and frame precision entries across all asset classes and timeframes.

免責事項
これらの情報および投稿は、TradingViewが提供または承認する金融、投資、取引、またはその他の種類の助言もしくは推奨であることを意図したものではなく、またこれらに該当するものでもありません。詳細は利用規約をご覧ください。
免責事項
これらの情報および投稿は、TradingViewが提供または承認する金融、投資、取引、またはその他の種類の助言もしくは推奨であることを意図したものではなく、またこれらに該当するものでもありません。詳細は利用規約をご覧ください。