Relative Strength Line v1.3
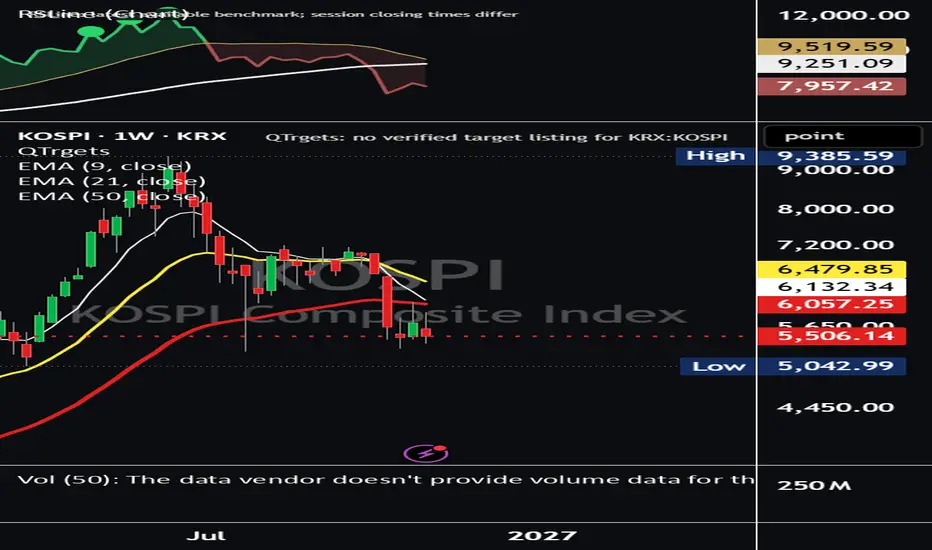
RSLine measures a stock’s performance relative to a chosen benchmark, with QQQ as the default. A rising line indicates outperformance; a falling line indicates underperformance.
Includes adjustable moving averages, green/red trend shading and new-high markers:
- **Green:** RS and price both exceed their previous lookback highs.
- **Purple:** RS exceeds its previous high while price has yet to exceed its own.
Calculate Daily, Weekly or Monthly RS independently of your chart timeframe. An optional table displays relative returns across multiple periods. Dots confirm after both the selected RS period and chart candle close.
Designed for standard Daily, Weekly and Monthly charts.
Includes adjustable moving averages, green/red trend shading and new-high markers:
- **Green:** RS and price both exceed their previous lookback highs.
- **Purple:** RS exceeds its previous high while price has yet to exceed its own.
Calculate Daily, Weekly or Monthly RS independently of your chart timeframe. An optional table displays relative returns across multiple periods. Dots confirm after both the selected RS period and chart candle close.
Designed for standard Daily, Weekly and Monthly charts.

@StocksMathPoker on X
1amInvesting.com
1amInvesting.com
免責事項
これらの情報および投稿は、TradingViewが提供または承認する金融、投資、取引、またはその他の種類の助言もしくは推奨であることを意図したものではなく、またこれらに該当するものでもありません。詳細は利用規約をご覧ください。
@StocksMathPoker on X
1amInvesting.com
1amInvesting.com
免責事項
これらの情報および投稿は、TradingViewが提供または承認する金融、投資、取引、またはその他の種類の助言もしくは推奨であることを意図したものではなく、またこれらに該当するものでもありません。詳細は利用規約をご覧ください。