OPEN-SOURCE SCRIPT
更新済 Close Momentum (Area)
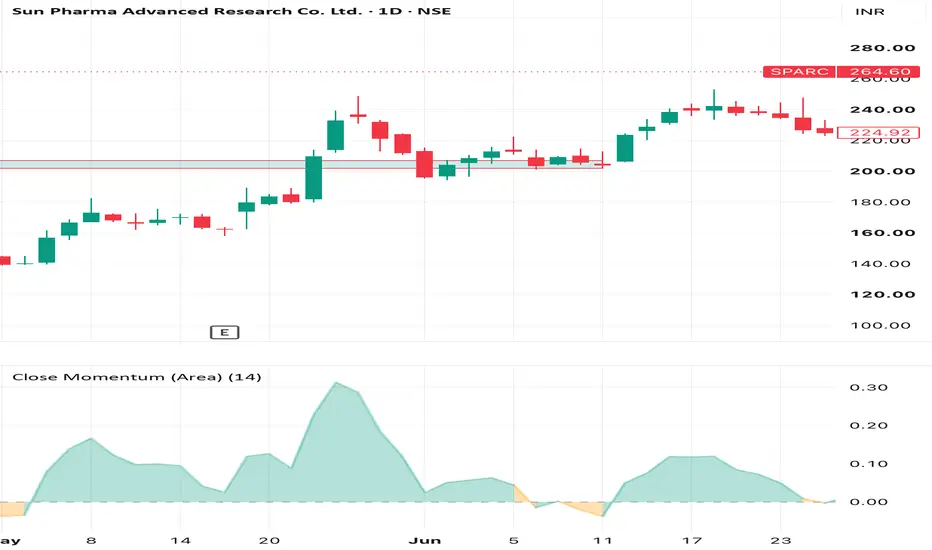
This indicator measures how today’s closing price compares to its own average over a user-defined lookback period (default: ~6 months). It helps you quickly see whether price is trading above or below its medium-term average in a single, easy-to-read pane.
Formula:
Momentum = Close ÷ Average Close (over N days)
• Momentum > 1 → Price is above its N-day average (bullish relative to medium-term mean).
• Momentum = 1 → Price equals its N-day average.
• Momentum < 1 → Price is below its N-day average (bearish relative to medium-term mean).
The result is plotted as a filled area anchored at the 1.0 line, making it easy tospot regimes where price is persistently strong (>1) or weak (<1).
Settings:
• Lookback days for average close – Number of bars used to calculate the average close.
• Default: 126 (≈ 6 months, assuming ~21 trading days/month).
• Adjust for shorter/longer horizons (e.g., 63 for ~3 months, 252 for ~1 year).
How traders can use it:
• Identify trend bias: sustained readings above 1 suggest an uptrend relative to the chosen period; below 1 suggests a downtrend.
• Spot mean-reversion setups: extremes far from 1 may indicate overextended moves.
• Combine with price action or other indicators to filter entries and confirm momentum shifts.
This is a simple, visual way to track medium-term price momentum without cluttering your main chart.
Formula:
Momentum = Close ÷ Average Close (over N days)
• Momentum > 1 → Price is above its N-day average (bullish relative to medium-term mean).
• Momentum = 1 → Price equals its N-day average.
• Momentum < 1 → Price is below its N-day average (bearish relative to medium-term mean).
The result is plotted as a filled area anchored at the 1.0 line, making it easy tospot regimes where price is persistently strong (>1) or weak (<1).
Settings:
• Lookback days for average close – Number of bars used to calculate the average close.
• Default: 126 (≈ 6 months, assuming ~21 trading days/month).
• Adjust for shorter/longer horizons (e.g., 63 for ~3 months, 252 for ~1 year).
How traders can use it:
• Identify trend bias: sustained readings above 1 suggest an uptrend relative to the chosen period; below 1 suggests a downtrend.
• Spot mean-reversion setups: extremes far from 1 may indicate overextended moves.
• Combine with price action or other indicators to filter entries and confirm momentum shifts.
This is a simple, visual way to track medium-term price momentum without cluttering your main chart.
リリースノート
• momentum itself is centered around 1.0, so plotting it with area style makes TradingView fill the space between 1 and the value.• By plotting delta = momentum - 1.0 , the baseline becomes 0, so the filled area is centered properly and no longer occupies the full band from 1 to 0.
リリースノート
changed the nameオープンソーススクリプト
TradingViewの精神に則り、このスクリプトの作者はコードをオープンソースとして公開してくれました。トレーダーが内容を確認・検証できるようにという配慮です。作者に拍手を送りましょう!無料で利用できますが、コードの再公開はハウスルールに従う必要があります。

免責事項
これらの情報および投稿は、TradingViewが提供または承認する金融、投資、取引、またはその他の種類の助言もしくは推奨であることを意図したものではなく、またこれらに該当するものでもありません。詳細は利用規約をご覧ください。
オープンソーススクリプト
TradingViewの精神に則り、このスクリプトの作者はコードをオープンソースとして公開してくれました。トレーダーが内容を確認・検証できるようにという配慮です。作者に拍手を送りましょう!無料で利用できますが、コードの再公開はハウスルールに従う必要があります。
免責事項
これらの情報および投稿は、TradingViewが提供または承認する金融、投資、取引、またはその他の種類の助言もしくは推奨であることを意図したものではなく、またこれらに該当するものでもありません。詳細は利用規約をご覧ください。