OPEN-SOURCE SCRIPT
The Setup Factory Short-Term Extension
The Setup Factory Short-Term Extension
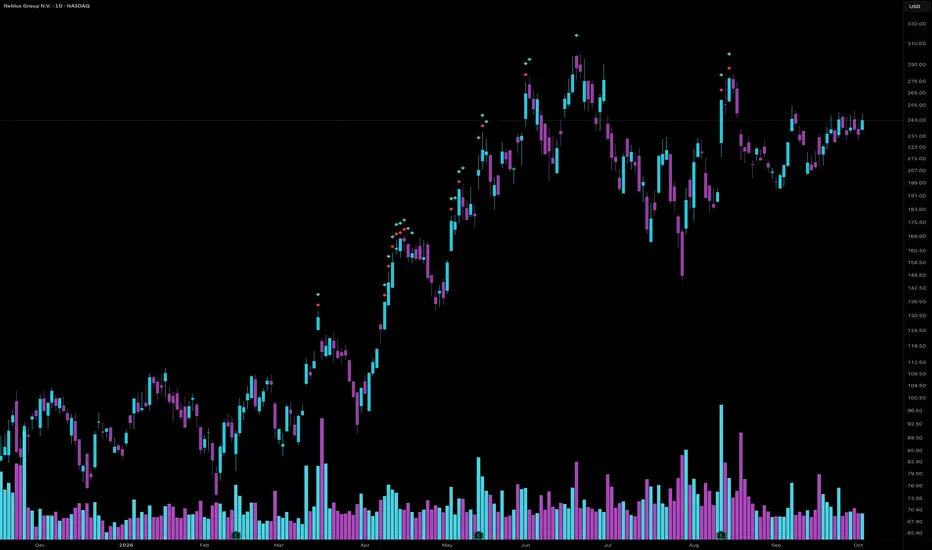
This indicator marks the bars where a stock's close is stretched far above its short-term moving averages, measured in ATRs. It shows two levels of extension, one against the 9 EMA and one against the 21 EMA.
WHAT IT SHOWS
- Red marker: the close is 2 or more ATRs above the 9 EMA.
- Teal marker: the close is 2.5 or more ATRs above the 21 EMA. When both apply, the teal marker sits above the red one.
- Only extension to the upside is marked.
HOW IT IS CALCULATED
The distance of the close above the EMA, as a percentage of the EMA, is divided by the ATR(14) as a percentage of the close:
Extension = ((Close - EMA) / EMA) / (ATR / Close)
A marker appears when that value reaches the threshold for its EMA.
HOW TO USE IT
Use the markers to see when a move has become stretched in the short term, for example before adding to a position or when deciding whether to take some profit into strength. The markers describe how extended price is. They are not buy or sell signals. A marker on the current bar is final once the bar closes.
SETTINGS
Each marker can be switched on or off, and its EMA length, ATR threshold, colour and shape can be changed. The ATR length can also be changed.
This is the extension formula and calibration used in The Setup Factory's own tools, published as one fixed standard. All rules it applies are stated above.
This indicator marks the bars where a stock's close is stretched far above its short-term moving averages, measured in ATRs. It shows two levels of extension, one against the 9 EMA and one against the 21 EMA.
WHAT IT SHOWS
- Red marker: the close is 2 or more ATRs above the 9 EMA.
- Teal marker: the close is 2.5 or more ATRs above the 21 EMA. When both apply, the teal marker sits above the red one.
- Only extension to the upside is marked.
HOW IT IS CALCULATED
The distance of the close above the EMA, as a percentage of the EMA, is divided by the ATR(14) as a percentage of the close:
Extension = ((Close - EMA) / EMA) / (ATR / Close)
A marker appears when that value reaches the threshold for its EMA.
HOW TO USE IT
Use the markers to see when a move has become stretched in the short term, for example before adding to a position or when deciding whether to take some profit into strength. The markers describe how extended price is. They are not buy or sell signals. A marker on the current bar is final once the bar closes.
SETTINGS
Each marker can be switched on or off, and its EMA length, ATR threshold, colour and shape can be changed. The ATR length can also be changed.
This is the extension formula and calibration used in The Setup Factory's own tools, published as one fixed standard. All rules it applies are stated above.
オープンソーススクリプト
TradingViewの精神に則り、このスクリプトの作者はコードをオープンソースとして公開してくれました。トレーダーが内容を確認・検証できるようにという配慮です。作者に拍手を送りましょう!無料で利用できますが、コードの再公開はハウスルールに従う必要があります。

免責事項
これらの情報および投稿は、TradingViewが提供または承認する金融、投資、取引、またはその他の種類の助言もしくは推奨であることを意図したものではなく、またこれらに該当するものでもありません。詳細は利用規約をご覧ください。
オープンソーススクリプト
TradingViewの精神に則り、このスクリプトの作者はコードをオープンソースとして公開してくれました。トレーダーが内容を確認・検証できるようにという配慮です。作者に拍手を送りましょう!無料で利用できますが、コードの再公開はハウスルールに従う必要があります。
免責事項
これらの情報および投稿は、TradingViewが提供または承認する金融、投資、取引、またはその他の種類の助言もしくは推奨であることを意図したものではなく、またこれらに該当するものでもありません。詳細は利用規約をご覧ください。