アップデート済
The Islnd Tap and Fill
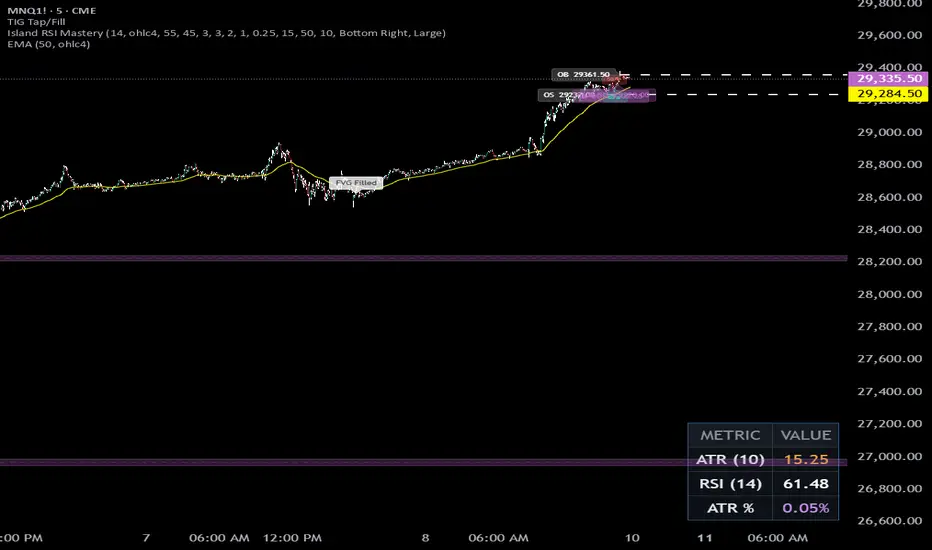
The Islnd Tap and Fill indicator automatically identifies and visualizes Bullish and Bearish Gaps using a three‑candle pattern.
It plots colored zones extended to the right, draws an optional midline with price labels, and tracks each gap’s lifecycle.
When price first trades back into a gap, the indicator marks a “Tap”; when price fully closes through the gap, it removes the zone and associated markings and prints an “FVG Filled” label.
This provides a clear, structured view of where price has left and later revisited imbalanced areas, supporting precise entry, management, and exit decisions.
It plots colored zones extended to the right, draws an optional midline with price labels, and tracks each gap’s lifecycle.
When price first trades back into a gap, the indicator marks a “Tap”; when price fully closes through the gap, it removes the zone and associated markings and prints an “FVG Filled” label.
This provides a clear, structured view of where price has left and later revisited imbalanced areas, supporting precise entry, management, and exit decisions.
リリースノート
Improved v2.0
免責事項
これらの情報および投稿は、TradingViewが提供または承認する金融、投資、取引、またはその他の種類の助言もしくは推奨であることを意図したものではなく、またこれらに該当するものでもありません。詳細は利用規約をご覧ください。
免責事項
これらの情報および投稿は、TradingViewが提供または承認する金融、投資、取引、またはその他の種類の助言もしくは推奨であることを意図したものではなく、またこれらに該当するものでもありません。詳細は利用規約をご覧ください。