OPEN-SOURCE SCRIPT
Delta Bubbles + Absorption
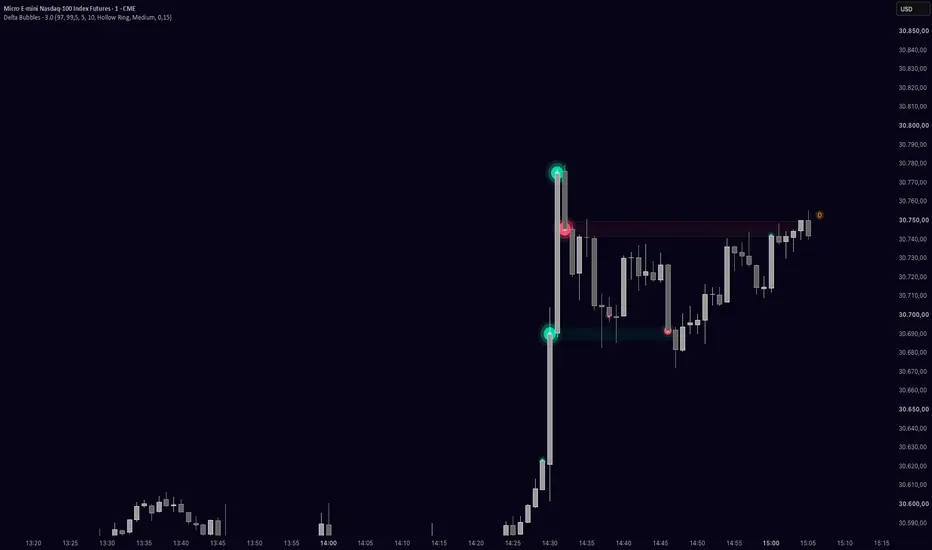
Delta Bubbles & Absorption highlights candles with unusually strong buying or selling and follows what happens next: do the traders behind a bubble defend their level, or do they get trapped? It also spots aggression that got absorbed at a swing high or low.
Only the top few percent of delta events are drawn, so the chart stays readable and every bubble is a real outlier.
HOW IT WORKS
Delta
For each candle the script pulls lower timeframe data (1m on charts up to 1H, 5m up to 4H, 15m up to 1D, 60m above that). Every intrabar candle counts its volume as buying or selling based on its direction, and the sum is the candle's delta. On 1m charts and below, the chart candles themselves are used. Where no intrabar data is available, for example deep in the history, delta is estimated from where the candle closed within its range.
Bubbles
The absolute delta of every candle is ranked against the last 500 candles. A bubble appears when:
- delta is above the Bubble Threshold (default 97th percentile, roughly the top 3 %)
- delta points the same way as the candle (buy delta on a green candle, sell delta on a red one)
There are three sizes. The biggest ones need delta above the Ray Threshold (default 99.5th percentile) and a net delta of at least 30 % of the candle's total volume. A minimum spacing between bubbles stops clusters from stacking up. Strong bubbles always show.
Defended or trapped
A big bubble means a lot of traders opened positions aggressively around that price. Their average entry sits close to the bubble, and that's what makes the level interesting later on.
As long as price stays on their side, those traders are in profit. When price comes back to their entry, they often step in again to protect their positions. That's why the level of a buy bubble can act as support and the level of a sell bubble as resistance.
If a candle closes through their entry, they're in loss and trapped. Their stops and exits are orders in the opposite direction, which can push the move further.
Rays
Strong bubbles project their entry area to the right as a zone (bubble price ± Width in ATR) with a dotted midline. As long as the ray is active, the level hasn't been broken. When price returns to it and holds, that's the defense. The ray ends when a candle closes through the zone, which is the moment the bubble traders get trapped. Broken rays can stay on the chart faded out or get removed.
Trapped mark ("−")
Every bubble, including the smaller ones, is also checked for a quick failure. If a candle closes against it within the next few candles (Window, default 10), past its price plus a small ATR buffer, the bubble gets a "−". Those traders got caught right away, and their exits can add fuel to the move against them. After the window the bubble isn't checked anymore, since a move against it much later says little about those traders.
Absorption
Absorption means heavy aggression that couldn't move price. A candle is flagged when all four are true:
1. strong delta
2. little progress: a small body compared to ATR, or the candle closed against its own delta
3. the candle printed the highest high (buy delta) or lowest low (sell delta) of the recent lookback
4. a rejection wick on that same side
Sensitivity (Low / Medium / High) adjusts all four thresholds together. Absorption bubbles sit on the wick where it happened. Colors follow the delta, so a green absorption bubble at a high means buyers got absorbed (bearish hint) and a red one at a low means sellers got absorbed (bullish hint). They use a different style than normal bubbles (white border by default).
HOW TO USE
- When price comes back to a ray and holds, the bubble side is defending its level. That retest can be a spot to look for entries in the bubble's direction.
- A close through a ray means the bubble traders are trapped. Watch for follow-through in the direction of the break.
- Absorption at a swing high or low can hint at a turn, more so when the following candles confirm it.
It works best as extra context next to your own levels and market structure.
SETTINGS
Bubbles: Show Bubbles, Bubble Threshold, Ray Threshold, Min Spacing, Colors, Mark Trapped + Window
Absorption: Show Absorption, Style, BG (only for the ring styles), Sensitivity
Rays: Show Rays, Width (x ATR), Keep Broken Rays
ALERTS
Strong Buy Bubble, Strong Sell Bubble, Bullish Absorption, Bearish Absorption, Trapped Buyers, Trapped Sellers. All alerts fire on candle close.
NOTES
- The script needs volume data. On feeds with tick volume only (many forex and CFD symbols), delta is less meaningful.
- Delta is built from intrabar candles, so it approximates order flow and is less precise than tick or footprint data.
- Bubbles and absorption on the live candle can still change until it closes. Rays and trapped marks are only created on closed candles.
This script is for educational purposes only and is not financial advice.
Only the top few percent of delta events are drawn, so the chart stays readable and every bubble is a real outlier.
HOW IT WORKS
Delta
For each candle the script pulls lower timeframe data (1m on charts up to 1H, 5m up to 4H, 15m up to 1D, 60m above that). Every intrabar candle counts its volume as buying or selling based on its direction, and the sum is the candle's delta. On 1m charts and below, the chart candles themselves are used. Where no intrabar data is available, for example deep in the history, delta is estimated from where the candle closed within its range.
Bubbles
The absolute delta of every candle is ranked against the last 500 candles. A bubble appears when:
- delta is above the Bubble Threshold (default 97th percentile, roughly the top 3 %)
- delta points the same way as the candle (buy delta on a green candle, sell delta on a red one)
There are three sizes. The biggest ones need delta above the Ray Threshold (default 99.5th percentile) and a net delta of at least 30 % of the candle's total volume. A minimum spacing between bubbles stops clusters from stacking up. Strong bubbles always show.
Defended or trapped
A big bubble means a lot of traders opened positions aggressively around that price. Their average entry sits close to the bubble, and that's what makes the level interesting later on.
As long as price stays on their side, those traders are in profit. When price comes back to their entry, they often step in again to protect their positions. That's why the level of a buy bubble can act as support and the level of a sell bubble as resistance.
If a candle closes through their entry, they're in loss and trapped. Their stops and exits are orders in the opposite direction, which can push the move further.
Rays
Strong bubbles project their entry area to the right as a zone (bubble price ± Width in ATR) with a dotted midline. As long as the ray is active, the level hasn't been broken. When price returns to it and holds, that's the defense. The ray ends when a candle closes through the zone, which is the moment the bubble traders get trapped. Broken rays can stay on the chart faded out or get removed.
Trapped mark ("−")
Every bubble, including the smaller ones, is also checked for a quick failure. If a candle closes against it within the next few candles (Window, default 10), past its price plus a small ATR buffer, the bubble gets a "−". Those traders got caught right away, and their exits can add fuel to the move against them. After the window the bubble isn't checked anymore, since a move against it much later says little about those traders.
Absorption
Absorption means heavy aggression that couldn't move price. A candle is flagged when all four are true:
1. strong delta
2. little progress: a small body compared to ATR, or the candle closed against its own delta
3. the candle printed the highest high (buy delta) or lowest low (sell delta) of the recent lookback
4. a rejection wick on that same side
Sensitivity (Low / Medium / High) adjusts all four thresholds together. Absorption bubbles sit on the wick where it happened. Colors follow the delta, so a green absorption bubble at a high means buyers got absorbed (bearish hint) and a red one at a low means sellers got absorbed (bullish hint). They use a different style than normal bubbles (white border by default).
HOW TO USE
- When price comes back to a ray and holds, the bubble side is defending its level. That retest can be a spot to look for entries in the bubble's direction.
- A close through a ray means the bubble traders are trapped. Watch for follow-through in the direction of the break.
- Absorption at a swing high or low can hint at a turn, more so when the following candles confirm it.
It works best as extra context next to your own levels and market structure.
SETTINGS
Bubbles: Show Bubbles, Bubble Threshold, Ray Threshold, Min Spacing, Colors, Mark Trapped + Window
Absorption: Show Absorption, Style, BG (only for the ring styles), Sensitivity
Rays: Show Rays, Width (x ATR), Keep Broken Rays
ALERTS
Strong Buy Bubble, Strong Sell Bubble, Bullish Absorption, Bearish Absorption, Trapped Buyers, Trapped Sellers. All alerts fire on candle close.
NOTES
- The script needs volume data. On feeds with tick volume only (many forex and CFD symbols), delta is less meaningful.
- Delta is built from intrabar candles, so it approximates order flow and is less precise than tick or footprint data.
- Bubbles and absorption on the live candle can still change until it closes. Rays and trapped marks are only created on closed candles.
This script is for educational purposes only and is not financial advice.
オープンソーススクリプト
TradingViewの精神に則り、このスクリプトの作者はコードをオープンソースとして公開してくれました。トレーダーが内容を確認・検証できるようにという配慮です。作者に拍手を送りましょう!無料で利用できますが、コードの再公開はハウスルールに従う必要があります。

AssayCharts — premium TradingView indicators
assaycharts.com
assaycharts.com
免責事項
これらの情報および投稿は、TradingViewが提供または承認する金融、投資、取引、またはその他の種類の助言もしくは推奨であることを意図したものではなく、またこれらに該当するものでもありません。詳細は利用規約をご覧ください。
オープンソーススクリプト
TradingViewの精神に則り、このスクリプトの作者はコードをオープンソースとして公開してくれました。トレーダーが内容を確認・検証できるようにという配慮です。作者に拍手を送りましょう!無料で利用できますが、コードの再公開はハウスルールに従う必要があります。
AssayCharts — premium TradingView indicators
assaycharts.com
assaycharts.com
免責事項
これらの情報および投稿は、TradingViewが提供または承認する金融、投資、取引、またはその他の種類の助言もしくは推奨であることを意図したものではなく、またこれらに該当するものでもありません。詳細は利用規約をご覧ください。