OPEN-SOURCE SCRIPT
更新済 CBC Table [MMT]
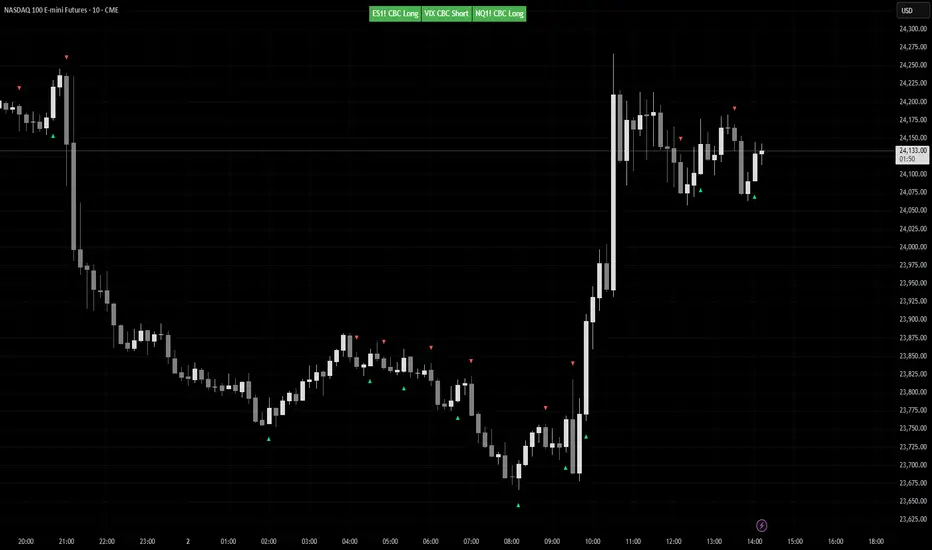
CBC Table [MMT] is a multi-asset Candle-by-Candle status table that lets you monitor confirmed CBC direction across up to three configurable symbols from one chart. It is designed to show the latest confirmed CBC state from a selected timeframe, while only displaying the table when the current chart matches one of the configured symbols.
This makes it useful for traders who want to track correlated or inverse markets such as ES/NQ/VIX, GC/DXY, or any custom asset set without hardcoding the script to one specific pair.
How it works
For each enabled symbol, the script requests data from the selected CBC timeframe and tracks whether that market is currently in a CBC bullish or bearish state based on confirmed candle closes. The status shown in the table is the latest confirmed state, so it does not flip back and forth intrabar while the higher-timeframe candle is still forming.
The script also checks whether the current chart symbol matches one of the enabled symbols. If it does, the table is shown with the CBC status for all enabled assets; if it does not, the script displays a non-matching message instead of showing unrelated pair data.
Features
How to use
Example use cases
Notes
This makes it useful for traders who want to track correlated or inverse markets such as ES/NQ/VIX, GC/DXY, or any custom asset set without hardcoding the script to one specific pair.
How it works
For each enabled symbol, the script requests data from the selected CBC timeframe and tracks whether that market is currently in a CBC bullish or bearish state based on confirmed candle closes. The status shown in the table is the latest confirmed state, so it does not flip back and forth intrabar while the higher-timeframe candle is still forming.
The script also checks whether the current chart symbol matches one of the enabled symbols. If it does, the table is shown with the CBC status for all enabled assets; if it does not, the script displays a non-matching message instead of showing unrelated pair data.
Features
- Monitor up to 3 custom symbols
- User-selectable CBC timeframe
- Symbol-based chart matching
- Confirmed-state CBC logic
- Optional inverse color handling for assets like VIX or DXY
- Dynamic table sizing based on enabled assets
- Automatic symbol label extraction from the selected ticker
- Optional candle markers for CBC flips
How to use
- Choose the timeframe you want CBC to be calculated from.
- Select up to three symbols in the settings.
- Enable or disable any asset slot as needed.
- Use invert colors for symbols that are interpreted inversely relative to your main market.
- Apply the script to one of the selected chart symbols to see the table and any flip markers.
Example use cases
- ES / NQ / VIX
- GC / DXY
- CL / XLE
- Any custom intermarket or confirmation set you want to monitor from one chart
Notes
- CBC state updates only on confirmed candles from the selected timeframe.
- Flip markers are plotted only for the currently matched chart symbol so markers stay aligned with the candles on the chart.
リリースノート
Bug Fix:Remove the constraint of requiring current chart needs to be one of the tickers in the settings to show
オープンソーススクリプト
TradingViewの精神に則り、このスクリプトの作者はコードをオープンソースとして公開してくれました。トレーダーが内容を確認・検証できるようにという配慮です。作者に拍手を送りましょう!無料で利用できますが、コードの再公開はハウスルールに従う必要があります。

免責事項
これらの情報および投稿は、TradingViewが提供または承認する金融、投資、取引、またはその他の種類の助言もしくは推奨であることを意図したものではなく、またこれらに該当するものでもありません。詳細は利用規約をご覧ください。
オープンソーススクリプト
TradingViewの精神に則り、このスクリプトの作者はコードをオープンソースとして公開してくれました。トレーダーが内容を確認・検証できるようにという配慮です。作者に拍手を送りましょう!無料で利用できますが、コードの再公開はハウスルールに従う必要があります。
免責事項
これらの情報および投稿は、TradingViewが提供または承認する金融、投資、取引、またはその他の種類の助言もしくは推奨であることを意図したものではなく、またこれらに該当するものでもありません。詳細は利用規約をご覧ください。