OPEN-SOURCE SCRIPT
SwiftEdge Liquidity Defense
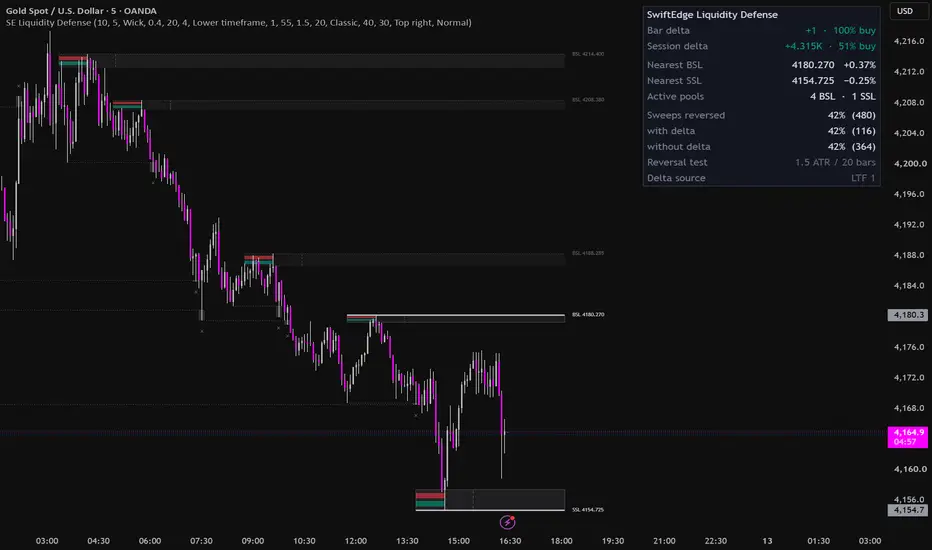
SwiftEdge Liquidity Defense maps the liquidity resting above swing highs and below swing lows, and shows who has been trading at each level since it formed. Each pool is split into how the level was built and how it has been defended, using volume delta. That way you can see whether a level is being absorbed or abandoned before price returns to it.
WHAT IT SHOWS
• Liquidity pools
Buy-side liquidity (BSL) sits above confirmed swing highs, where stops of short positions and breakout orders typically rest. Sell-side liquidity (SSL) sits below confirmed swing lows. Each pool is drawn as a zone from the swing candle's body to its wick tip (or as an ATR band), with a level line and a price tag at the right edge.
• Formation (left section of each zone)
Two horizontal bars show the volume of the bars that built the swing: sellers on top, buyers below. The length of each bar is that side's share of the volume.
• Defense profile (right section, projected forward)
A small volume profile of everything traded inside the zone after it formed. The zone is split into rows by price, and each row's length is the volume traded at that slice, split into buyers and sellers. The profile updates while the level is alive, so you can see where inside the zone the activity happened and which side was in control.
• Pool size and nearest pools
Zone intensity follows the formation volume relative to the 100-bar average, so larger pools stand out. The nearest buy-side pool above price and the nearest sell-side pool below price are highlighted and marked on the price scale.
• Sweeps and breaks
When a wick trades beyond a level but the bar closes back inside, the pool is marked as swept: the level becomes a dotted line, the grab is shaded and an × marks the wick. When a bar closes beyond the level, the pool is treated as broken and removed. A sweep whose bar delta leans toward the reversal side, above a share you choose (55% by default), is additionally marked with a small triangle.
• Panel
The panel shows bar delta and session delta, the nearest BSL and SSL with distance in percent, and the number of active pools. It also shows a simple measurement on the loaded history: how often a sweep was followed by a move of N × ATR in the reversal direction within a set number of bars, before any bar closed beyond the sweep wick. The result is shown for all sweeps, for sweeps with delta confirmation, and for sweeps without it. This lets you check on your own symbol and timeframe whether delta confirmation adds anything.
HOW IT WORKS
1. Swings are found with a pivot of "Swing length" bars on each side. A pool is created once the swing is confirmed.
2. Buy and sell volume is estimated per bar from lower-timeframe candles: an up candle counts as buy volume and a down candle as sell volume. The lower timeframe is chosen automatically from the chart timeframe (15m and below use 1m, 1H uses 5m, 4H uses 15m, daily uses 1H, higher uses 4H) or set manually. Without lower-timeframe data, the bar's close location within its range is used instead.
3. Formation volume is the sum over the bars around the swing (Swing length bars on each side).
4. Defense volume: every bar that overlaps a zone adds its buy and sell volume to the rows it touches, in proportion to how much of the bar's range overlaps each row.
5. Sweeps, breaks and signals are evaluated on bar close by default.
HOW TO USE IT
• Treat active pools as areas price is likely to be drawn toward, and the defense profile as context for how the level is being handled.
• A pool whose defense is dominated by the opposite side (for example sell-side liquidity defended by sellers) suggests the level is being worked through rather than held.
• Use the sweep statistics to judge, on your own market and timeframe, how often sweeps reversed and whether delta confirmation helped, instead of assuming it does.
• All elements (formation, profile, level lines, tags, sweep marks, reversal marks, price-scale marks, panel) can be switched off, and four colour themes are included.
WHAT MAKES IT DIFFERENT
Most liquidity tools only mark where swing highs and lows are and when they are taken. This script adds:
• a separation between the volume that formed a level and the volume traded at it afterwards,
• a per-zone volume profile split by buyers and sellers, so you can see where inside the zone the activity happened,
• a clear separation between a sweep (wick and close back) and a break (close beyond),
• a built-in measurement of sweep outcomes with and without delta confirmation, so the delta filter can be judged on data.
LIMITATIONS
• Delta is an estimate based on candle direction or close location. TradingView does not provide bid/ask tape data to Pine scripts, so it is not true order-flow delta.
• Lower-timeframe history is limited by TradingView. On older bars, or when no lower-timeframe data is available, the close-location estimate is used.
• Swings are only known Swing length bars after the high or low, so each zone is drawn back from its swing point once confirmed. With "Confirm on bar close" enabled (default), sweeps, breaks and marks do not change after the bar closes.
• The volume used depends on your data feed. On symbols without volume the delta features cannot work.
• The sweep statistics describe the history loaded on your chart. They are not a forecast and are not a trading system.
This script is for analysis and education. It does not provide trading advice, and past behaviour shown on the chart does not imply future results.
WHAT IT SHOWS
• Liquidity pools
Buy-side liquidity (BSL) sits above confirmed swing highs, where stops of short positions and breakout orders typically rest. Sell-side liquidity (SSL) sits below confirmed swing lows. Each pool is drawn as a zone from the swing candle's body to its wick tip (or as an ATR band), with a level line and a price tag at the right edge.
• Formation (left section of each zone)
Two horizontal bars show the volume of the bars that built the swing: sellers on top, buyers below. The length of each bar is that side's share of the volume.
• Defense profile (right section, projected forward)
A small volume profile of everything traded inside the zone after it formed. The zone is split into rows by price, and each row's length is the volume traded at that slice, split into buyers and sellers. The profile updates while the level is alive, so you can see where inside the zone the activity happened and which side was in control.
• Pool size and nearest pools
Zone intensity follows the formation volume relative to the 100-bar average, so larger pools stand out. The nearest buy-side pool above price and the nearest sell-side pool below price are highlighted and marked on the price scale.
• Sweeps and breaks
When a wick trades beyond a level but the bar closes back inside, the pool is marked as swept: the level becomes a dotted line, the grab is shaded and an × marks the wick. When a bar closes beyond the level, the pool is treated as broken and removed. A sweep whose bar delta leans toward the reversal side, above a share you choose (55% by default), is additionally marked with a small triangle.
• Panel
The panel shows bar delta and session delta, the nearest BSL and SSL with distance in percent, and the number of active pools. It also shows a simple measurement on the loaded history: how often a sweep was followed by a move of N × ATR in the reversal direction within a set number of bars, before any bar closed beyond the sweep wick. The result is shown for all sweeps, for sweeps with delta confirmation, and for sweeps without it. This lets you check on your own symbol and timeframe whether delta confirmation adds anything.
HOW IT WORKS
1. Swings are found with a pivot of "Swing length" bars on each side. A pool is created once the swing is confirmed.
2. Buy and sell volume is estimated per bar from lower-timeframe candles: an up candle counts as buy volume and a down candle as sell volume. The lower timeframe is chosen automatically from the chart timeframe (15m and below use 1m, 1H uses 5m, 4H uses 15m, daily uses 1H, higher uses 4H) or set manually. Without lower-timeframe data, the bar's close location within its range is used instead.
3. Formation volume is the sum over the bars around the swing (Swing length bars on each side).
4. Defense volume: every bar that overlaps a zone adds its buy and sell volume to the rows it touches, in proportion to how much of the bar's range overlaps each row.
5. Sweeps, breaks and signals are evaluated on bar close by default.
HOW TO USE IT
• Treat active pools as areas price is likely to be drawn toward, and the defense profile as context for how the level is being handled.
• A pool whose defense is dominated by the opposite side (for example sell-side liquidity defended by sellers) suggests the level is being worked through rather than held.
• Use the sweep statistics to judge, on your own market and timeframe, how often sweeps reversed and whether delta confirmation helped, instead of assuming it does.
• All elements (formation, profile, level lines, tags, sweep marks, reversal marks, price-scale marks, panel) can be switched off, and four colour themes are included.
WHAT MAKES IT DIFFERENT
Most liquidity tools only mark where swing highs and lows are and when they are taken. This script adds:
• a separation between the volume that formed a level and the volume traded at it afterwards,
• a per-zone volume profile split by buyers and sellers, so you can see where inside the zone the activity happened,
• a clear separation between a sweep (wick and close back) and a break (close beyond),
• a built-in measurement of sweep outcomes with and without delta confirmation, so the delta filter can be judged on data.
LIMITATIONS
• Delta is an estimate based on candle direction or close location. TradingView does not provide bid/ask tape data to Pine scripts, so it is not true order-flow delta.
• Lower-timeframe history is limited by TradingView. On older bars, or when no lower-timeframe data is available, the close-location estimate is used.
• Swings are only known Swing length bars after the high or low, so each zone is drawn back from its swing point once confirmed. With "Confirm on bar close" enabled (default), sweeps, breaks and marks do not change after the bar closes.
• The volume used depends on your data feed. On symbols without volume the delta features cannot work.
• The sweep statistics describe the history loaded on your chart. They are not a forecast and are not a trading system.
This script is for analysis and education. It does not provide trading advice, and past behaviour shown on the chart does not imply future results.
オープンソーススクリプト
TradingViewの精神に則り、このスクリプトの作者はコードをオープンソースとして公開してくれました。トレーダーが内容を確認・検証できるようにという配慮です。作者に拍手を送りましょう!無料で利用できますが、コードの再公開はハウスルールに従う必要があります。

Order-flow and session tooling for BTC — swiftedge.uk/depth
免責事項
これらの情報および投稿は、TradingViewが提供または承認する金融、投資、取引、またはその他の種類の助言もしくは推奨であることを意図したものではなく、またこれらに該当するものでもありません。詳細は利用規約をご覧ください。
オープンソーススクリプト
TradingViewの精神に則り、このスクリプトの作者はコードをオープンソースとして公開してくれました。トレーダーが内容を確認・検証できるようにという配慮です。作者に拍手を送りましょう!無料で利用できますが、コードの再公開はハウスルールに従う必要があります。
Order-flow and session tooling for BTC — swiftedge.uk/depth
免責事項
これらの情報および投稿は、TradingViewが提供または承認する金融、投資、取引、またはその他の種類の助言もしくは推奨であることを意図したものではなく、またこれらに該当するものでもありません。詳細は利用規約をご覧ください。