アップデート済
ADK CVD
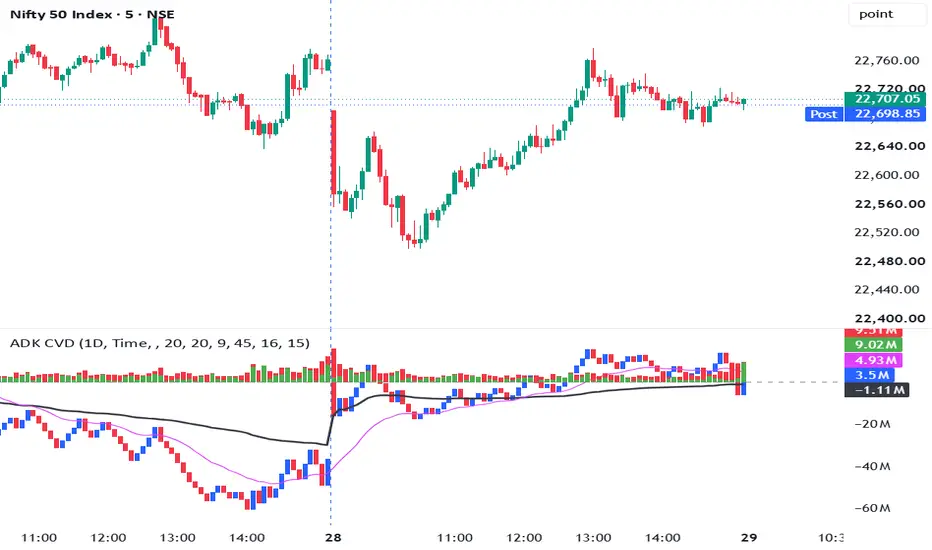
"Cumulative Volume Delta & Volume OWI By ADK" aka "ADK CVD"
A powerful dual-purpose volume analysis tool that combines Cumulative Volume Delta (CVD) and Volume Order Wave Indicator (VOWI) in one script.
What does this indicator do?
1. Cumulative Volume Delta (CVD)
Shows the net buying vs selling pressure using true volume delta calculation.
Built using TradingView’s official ta.requestVolumeDelta() for higher accuracy
Supports both Time-based and 1 Tick aggregation (tick mode available on Expert plans)
Fully customizable Anchor Period and lower timeframe settings
2. Volume OWI (Order Wave Indicator)
Visualizes Buy Volume vs Sell Volume as colored columns:
Helps traders quickly see which side is more aggressive on each bar.
Key Features
How to use
Use CVD to track institutional buying/selling pressure and potential divergences with price.
Use VOWI to see real-time order flow strength (Buy vs Sell volume).
Best used on liquid instruments (stocks, futures, crypto with good volume).
Recommended Settings:
Disclaimer
This indicator is for educational and informational purposes only. It does not constitute financial, investment, or trading advice. Past performance is not indicative of future results. Trading involves substantial risk of loss and is not suitable for every investor. Always do your own research and consult a qualified financial advisor before making any trading decisions. The authors and publishers of this script accept no liability for any losses incurred from its use.
Developed by ADK Team
A powerful dual-purpose volume analysis tool that combines Cumulative Volume Delta (CVD) and Volume Order Wave Indicator (VOWI) in one script.
What does this indicator do?
1. Cumulative Volume Delta (CVD)
Shows the net buying vs selling pressure using true volume delta calculation.
- Blue candles = Buying dominance
- Red candles = Selling dominance
Built using TradingView’s official ta.requestVolumeDelta() for higher accuracy
Supports both Time-based and 1 Tick aggregation (tick mode available on Expert plans)
Fully customizable Anchor Period and lower timeframe settings
2. Volume OWI (Order Wave Indicator)
Visualizes Buy Volume vs Sell Volume as colored columns:
- Green columns = Buy Volume
- Red columns = Sell Volume (Total Volume)
Helps traders quickly see which side is more aggressive on each bar.
Key Features
- Toggle CVD and VOWI independently
- Advanced CVD settings (Anchor Period, Data Aggregation, Custom Lower Timeframe)
- Optional US Market Hours time filter for VOWI
- Clean and optimized Pine Script v6 code
- Works on all symbols that provide volume data
How to use
Use CVD to track institutional buying/selling pressure and potential divergences with price.
Use VOWI to see real-time order flow strength (Buy vs Sell volume).
Best used on liquid instruments (stocks, futures, crypto with good volume).
Recommended Settings:
- CVD Anchor: 1D or Session
- Data Aggregation: Time (or 1 Tick if available)
- VOWI: Enable Time Filter for US stocks/futures
Disclaimer
This indicator is for educational and informational purposes only. It does not constitute financial, investment, or trading advice. Past performance is not indicative of future results. Trading involves substantial risk of loss and is not suitable for every investor. Always do your own research and consult a qualified financial advisor before making any trading decisions. The authors and publishers of this script accept no liability for any losses incurred from its use.
Developed by ADK Team
リリースノート
Release NotesVersion 2.0.1
Cumulative Volume Delta + VWAP + EMA & Volume OWI By ADK
A powerful all-in-one volume analysis tool that combines Cumulative Volume Delta (CVD), Volume OWI (VOWI), CVD VWAP, and CVD EMA in one clean, optimized Pine Script v6 indicator.
What does this indicator do?
1. Cumulative Volume Delta (CVD)
CVD shows the net buying versus selling pressure by accumulating volume delta over a selected anchor period. The script uses TradingView’s official ta.requestVolumeDelta() to scan lower-timeframe data and estimate the difference between up-volume and down-volume within each chart bar.
- Blue CVD candles = Buying dominance
- Red CVD candles = Selling dominance
- Supports Time-based and 1 Tick aggregation; tick mode is available on TradingView Expert plans
- Fully customizable Anchor Period and lower-timeframe settings
- Useful for identifying buying/selling pressure, momentum shifts, and CVD-versus-price divergences
2. CVD VWAP
The newly added CVD VWAP calculates a volume-weighted average of the CVD value, resetting automatically at the start of each daily session. Instead of applying VWAP to price, it applies it to CVD, helping smooth intraday volume-flow noise and identify whether current cumulative delta is above or below its session-average level.
- Toggle CVD VWAP on or off independently
- Resets every daily session for practical intraday analysis
- CVD above its VWAP may suggest relatively stronger sustained buying pressure
- CVD below its VWAP may suggest relatively stronger sustained selling pressure
- Useful for filtering CVD momentum and identifying potential shifts in order flow
3. CVD EMA
The CVD EMA applies an Exponential Moving Average directly to the CVD value. It provides a smooth, continuous trend reference for volume delta, making it easier to see whether buying or selling pressure is strengthening, weakening, or changing direction.
- Toggle CVD EMA on or off independently
- Customizable EMA length, with a default of 20
- Rising CVD EMA may indicate improving buying pressure
- Falling CVD EMA may indicate improving selling pressure
- Crossovers or separation between CVD and its EMA can help highlight momentum changes
4. Volume OWI (Order Wave Indicator)
VOWI visualizes buy volume versus total/sell volume as colored columns, helping traders quickly assess which side is more aggressive on each bar.
- Green columns = Estimated Buy Volume
- Red columns = Total Volume
- Optional US Market Hours time filter, with customizable start and end times in ET
- Can be enabled or disabled independently of CVD
Key Features
- Toggle CVD, CVD VWAP, CVD EMA, and VOWI independently
- Advanced CVD settings: Anchor Period, Data Aggregation, and Custom Lower Timeframe
- Built using TradingView’s official ta.requestVolumeDelta() for higher-quality volume delta calculation
- Daily-reset CVD VWAP for session-based volume-flow analysis
- Continuous CVD EMA for smoothing and momentum context
- Optional US Market Hours time filter for VOWI
- Clean and optimized Pine Script v6 code
- Works on all symbols that provide volume data
How to use
- Use CVD to track cumulative buying and selling pressure and look for divergences with price.
- Use CVD VWAP to determine whether current net volume flow is above or below its daily average.
- Use CVD EMA to confirm the direction and strength of CVD momentum.
- Use VOWI to observe bar-by-bar buy versus sell volume strength.
- Combine all modules to filter trades: for example, favor long setups when CVD is rising, CVD is above its VWAP, CVD EMA is rising, and VOWI shows stronger buy volume.
Recommended settings
CVD Anchor: 1D or Session
- Data Aggregation: Time, or 1 Tick if your TradingView plan supports it
- CVD VWAP: Enable for intraday charts
- CVD EMA Length: 20, or adjust according to your trading timeframe
- VOWI Time Filter: Enable for US stocks and futures
Disclaimer:
This indicator is for educational and informational purposes only. It does not constitute financial, investment, or trading advice. Past performance is not indicative of future results. Trading involves substantial risk of loss and is not suitable for every investor. Always do your own research and consult a qualified financial advisor before making trading decisions. The authors and publishers accept no liability for any losses incurred from its use.
Developed by ADK Team

免責事項
これらの情報および投稿は、TradingViewが提供または承認する金融、投資、取引、またはその他の種類の助言もしくは推奨であることを意図したものではなく、またこれらに該当するものでもありません。詳細は利用規約をご覧ください。
免責事項
これらの情報および投稿は、TradingViewが提供または承認する金融、投資、取引、またはその他の種類の助言もしくは推奨であることを意図したものではなく、またこれらに該当するものでもありません。詳細は利用規約をご覧ください。