Prism [vault]
Prism [vault]
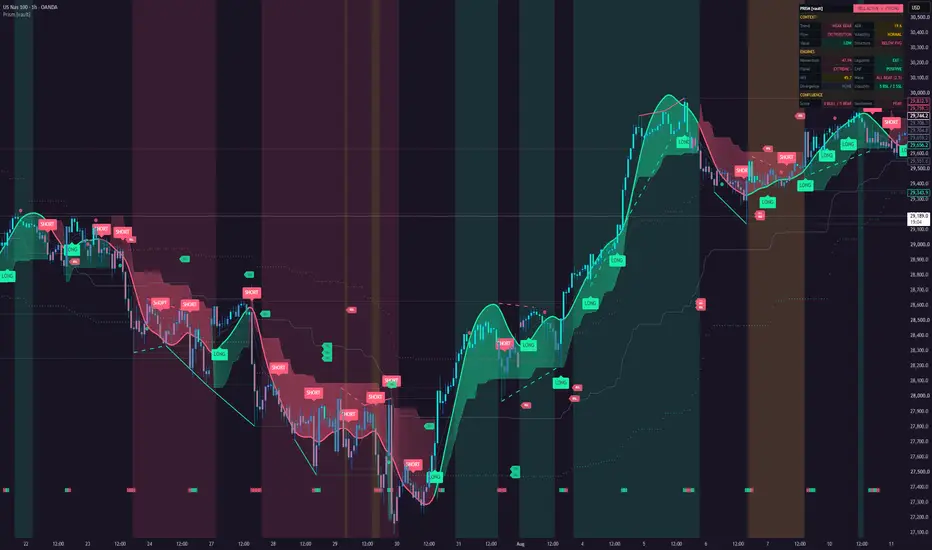
Prism takes eight independent reads of the market and fuses them into one confluence score. Instead of watching ten indicators and guessing which one matters, you get a single dashboard that tells you what the trend is, who is in control, where the liquidity sits and whether enough conditions line up to justify a trade.
How it works
Eight engines run on every bar. Each one votes bullish, bearish or neutral. The votes are counted and a signal fires only when one side clearly outweighs the other and the total score clears your threshold.
1. Momentum: Laguerre RSI, Fisher Transform, TSI, MFI, VFI, OBV and CMF blended into one normalized Momentum Index. Positive and rising = bullish vote.
2. Structure: supply and demand zones from volume-confirmed pivots, fair value gaps, mitigation tracking (wick, close or average fill). Price inside demand or above an FVG = bullish vote.
3. Wave: ALMA-smoothed momentum against five EMA basis levels. All basis levels aligned or momentum beyond 2 standard deviations = vote. Spread shows expansion or exhaustion.
4. Liquidity: buy side (BSL) and sell side (SSL) levels from swing points. A sweep is a wick through the level with a close back inside. Bullish sweep = bullish vote.
5. Trend matrix: Hull MA, SuperTrend, ADX, EMA 9/21/50 and SMA 100/200 combined into five regimes from Strong Bear to Strong Bull. Counter-trend setups (CTR dots) flag momentum turning against a weak trend at the Hull MA.
6. Divergence: price pivots checked against RSI, MACD, TSI and Stochastic. Regular divergence (solid line) needs at least two oscillators to agree. Hidden divergence drawn dashed.
7. Volatility: Bollinger inside Keltner = compression. Breakout direction on release becomes a vote. Volatility percentile ranks the regime as Low, Normal or High.
8. Flow: CMF, MFI, OBV and A/D tracked as a Flow Index with five phases from Strong Distribution to Strong Accumulation. Also feeds a sentiment gauge (Fear / Greed).
Two extra votes come from value (discount or premium relative to the 100-bar range) and volume surges on directional candles.
Signals
LONG fires when bullish votes reach the minimum score and beat bearish votes by at least the set margin, with price above the Hull MA. SHORT is the mirror. Strength: Weak (under 4), Moderate (4), Strong (5), Very Strong (6 to 7), Extreme (8+). A minimum bar gap between signals prevents clustering.
On the chart
- Hull MA colored by regime, SuperTrend band, gradient fill between them that gets denser as ADX rises
- SUP / DEM boxes, FVG boxes, BSL / SSL dashed levels
- Equilibrium line with discount and premium markers
- Optional candle coloring by flow phase or momentum
- Background tint for strong trends and compression
- Volume surge squares on the bottom
Dashboard
Three blocks: Context (trend, ADX, flow, volatility, value, structure), Engines (momentum, Laguerre, Fisher, CMF, MFI, wave, divergence, liquidity) and Confluence (score, sentiment). Live signal and strength sit in the header. Four color schemes, three text sizes, four positions.
How to trade it
1. Read Context first. Sideways plus Compression means wait for the breakout, do not chase.
2. Look for alignment: bullish trend, accumulation, discount value, price at demand.
3. Take LONG / SHORT labels only at Strong or better, and only in the direction of the higher timeframe.
4. Enter at the zone, stop beyond it, so risk is defined by structure not by feel.
5. Exit on the opposite signal or when Flow flips phase against you.
Alerts
Buy, Sell, Strong Bull, Strong Bear, Squeeze Breakout, Bullish Divergence, Bearish Divergence, Strong Accumulation, Strong Distribution, Bullish Sweep, Bearish Sweep, Extreme Greed, Extreme Fear.
Limits
Best on liquid instruments with real volume. On symbols without volume the flow and volume votes stay neutral, so max score drops. Signals describe current conditions, they do not predict. Use a stop every time.
Disclaimer
Educational tool, not financial advice. Trading carries substantial risk. Past signals do not guarantee future results. You are responsible for your own decisions.
Prism takes eight independent reads of the market and fuses them into one confluence score. Instead of watching ten indicators and guessing which one matters, you get a single dashboard that tells you what the trend is, who is in control, where the liquidity sits and whether enough conditions line up to justify a trade.
How it works
Eight engines run on every bar. Each one votes bullish, bearish or neutral. The votes are counted and a signal fires only when one side clearly outweighs the other and the total score clears your threshold.
1. Momentum: Laguerre RSI, Fisher Transform, TSI, MFI, VFI, OBV and CMF blended into one normalized Momentum Index. Positive and rising = bullish vote.
2. Structure: supply and demand zones from volume-confirmed pivots, fair value gaps, mitigation tracking (wick, close or average fill). Price inside demand or above an FVG = bullish vote.
3. Wave: ALMA-smoothed momentum against five EMA basis levels. All basis levels aligned or momentum beyond 2 standard deviations = vote. Spread shows expansion or exhaustion.
4. Liquidity: buy side (BSL) and sell side (SSL) levels from swing points. A sweep is a wick through the level with a close back inside. Bullish sweep = bullish vote.
5. Trend matrix: Hull MA, SuperTrend, ADX, EMA 9/21/50 and SMA 100/200 combined into five regimes from Strong Bear to Strong Bull. Counter-trend setups (CTR dots) flag momentum turning against a weak trend at the Hull MA.
6. Divergence: price pivots checked against RSI, MACD, TSI and Stochastic. Regular divergence (solid line) needs at least two oscillators to agree. Hidden divergence drawn dashed.
7. Volatility: Bollinger inside Keltner = compression. Breakout direction on release becomes a vote. Volatility percentile ranks the regime as Low, Normal or High.
8. Flow: CMF, MFI, OBV and A/D tracked as a Flow Index with five phases from Strong Distribution to Strong Accumulation. Also feeds a sentiment gauge (Fear / Greed).
Two extra votes come from value (discount or premium relative to the 100-bar range) and volume surges on directional candles.
Signals
LONG fires when bullish votes reach the minimum score and beat bearish votes by at least the set margin, with price above the Hull MA. SHORT is the mirror. Strength: Weak (under 4), Moderate (4), Strong (5), Very Strong (6 to 7), Extreme (8+). A minimum bar gap between signals prevents clustering.
On the chart
- Hull MA colored by regime, SuperTrend band, gradient fill between them that gets denser as ADX rises
- SUP / DEM boxes, FVG boxes, BSL / SSL dashed levels
- Equilibrium line with discount and premium markers
- Optional candle coloring by flow phase or momentum
- Background tint for strong trends and compression
- Volume surge squares on the bottom
Dashboard
Three blocks: Context (trend, ADX, flow, volatility, value, structure), Engines (momentum, Laguerre, Fisher, CMF, MFI, wave, divergence, liquidity) and Confluence (score, sentiment). Live signal and strength sit in the header. Four color schemes, three text sizes, four positions.
How to trade it
1. Read Context first. Sideways plus Compression means wait for the breakout, do not chase.
2. Look for alignment: bullish trend, accumulation, discount value, price at demand.
3. Take LONG / SHORT labels only at Strong or better, and only in the direction of the higher timeframe.
4. Enter at the zone, stop beyond it, so risk is defined by structure not by feel.
5. Exit on the opposite signal or when Flow flips phase against you.
Alerts
Buy, Sell, Strong Bull, Strong Bear, Squeeze Breakout, Bullish Divergence, Bearish Divergence, Strong Accumulation, Strong Distribution, Bullish Sweep, Bearish Sweep, Extreme Greed, Extreme Fear.
Limits
Best on liquid instruments with real volume. On symbols without volume the flow and volume votes stay neutral, so max score drops. Signals describe current conditions, they do not predict. Use a stop every time.
Disclaimer
Educational tool, not financial advice. Trading carries substantial risk. Past signals do not guarantee future results. You are responsible for your own decisions.

免責事項
これらの情報および投稿は、TradingViewが提供または承認する金融、投資、取引、またはその他の種類の助言もしくは推奨であることを意図したものではなく、またこれらに該当するものでもありません。詳細は利用規約をご覧ください。
免責事項
これらの情報および投稿は、TradingViewが提供または承認する金融、投資、取引、またはその他の種類の助言もしくは推奨であることを意図したものではなく、またこれらに該当するものでもありません。詳細は利用規約をご覧ください。