OPEN-SOURCE SCRIPT
RTH Previous Day Levels | VAH VAL POC PDH PDL
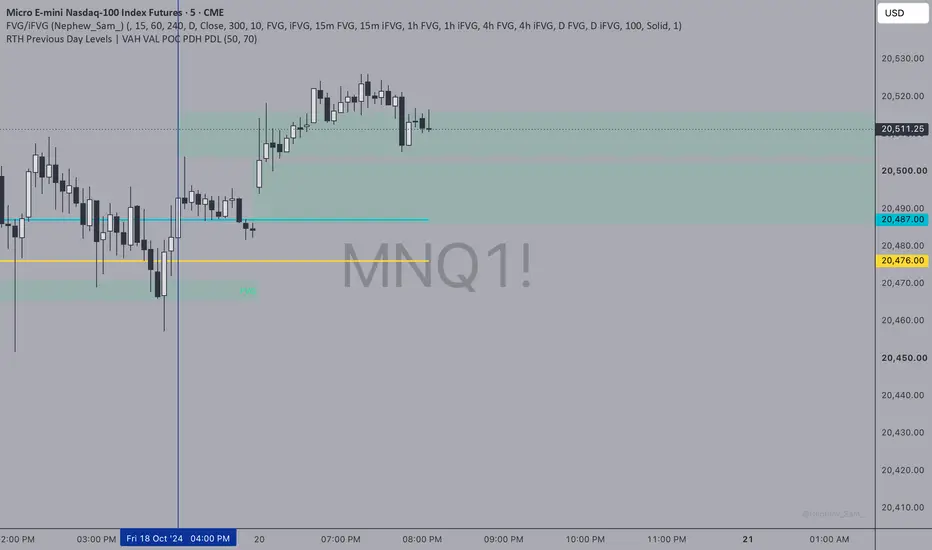
# Previous Day RTH Levels | VAH, VAL, POC, PDH & PDL
This indicator automatically plots five key price levels from the previous trading day's Regular Trading Hours (RTH) session, helping traders identify important areas of support, resistance, liquidity, and potential price acceptance or rejection.
Designed primarily for Nasdaq futures (NQ/MNQ), the indicator uses the New York RTH session (9:30 AM–4:00 PM ET).
### Key Features
- **PDH (Previous Day High):** The highest price reached during the previous RTH session.
- **PDL (Previous Day Low):** The lowest price reached during the previous RTH session.
- **VAH (Value Area High):** The upper boundary of the calculated value area.
- **VAL (Value Area Low):** The lower boundary of the calculated value area.
- **POC (Point of Control):** The price level with the highest estimated trading volume.
### Customization
- Individually enable or disable all five levels.
- Adjust volume profile resolution.
- Customize the value area percentage (70% default).
- Automatically updates levels for each new trading session.
### Trading Applications
Useful for identifying liquidity sweeps, breakouts, reversals, support and resistance, and price acceptance or rejection around previous-session levels.
### Important Notes
Volume profile levels are calculated using an estimated distribution of candle volume across price ranges. Results may differ from TradingView's built-in Volume Profile tools.
Designed for intraday charts, particularly the 5-minute timeframe.
**Disclaimer:** This indicator is intended for educational and technical analysis purposes only. It does not generate buy or sell signals and should not be considered financial advice.
This indicator automatically plots five key price levels from the previous trading day's Regular Trading Hours (RTH) session, helping traders identify important areas of support, resistance, liquidity, and potential price acceptance or rejection.
Designed primarily for Nasdaq futures (NQ/MNQ), the indicator uses the New York RTH session (9:30 AM–4:00 PM ET).
### Key Features
- **PDH (Previous Day High):** The highest price reached during the previous RTH session.
- **PDL (Previous Day Low):** The lowest price reached during the previous RTH session.
- **VAH (Value Area High):** The upper boundary of the calculated value area.
- **VAL (Value Area Low):** The lower boundary of the calculated value area.
- **POC (Point of Control):** The price level with the highest estimated trading volume.
### Customization
- Individually enable or disable all five levels.
- Adjust volume profile resolution.
- Customize the value area percentage (70% default).
- Automatically updates levels for each new trading session.
### Trading Applications
Useful for identifying liquidity sweeps, breakouts, reversals, support and resistance, and price acceptance or rejection around previous-session levels.
### Important Notes
Volume profile levels are calculated using an estimated distribution of candle volume across price ranges. Results may differ from TradingView's built-in Volume Profile tools.
Designed for intraday charts, particularly the 5-minute timeframe.
**Disclaimer:** This indicator is intended for educational and technical analysis purposes only. It does not generate buy or sell signals and should not be considered financial advice.
オープンソーススクリプト
TradingViewの精神に則り、このスクリプトの作者はコードをオープンソースとして公開してくれました。トレーダーが内容を確認・検証できるようにという配慮です。作者に拍手を送りましょう!無料で利用できますが、コードの再公開はハウスルールに従う必要があります。

免責事項
これらの情報および投稿は、TradingViewが提供または承認する金融、投資、取引、またはその他の種類の助言もしくは推奨であることを意図したものではなく、またこれらに該当するものでもありません。詳細は利用規約をご覧ください。
オープンソーススクリプト
TradingViewの精神に則り、このスクリプトの作者はコードをオープンソースとして公開してくれました。トレーダーが内容を確認・検証できるようにという配慮です。作者に拍手を送りましょう!無料で利用できますが、コードの再公開はハウスルールに従う必要があります。
免責事項
これらの情報および投稿は、TradingViewが提供または承認する金融、投資、取引、またはその他の種類の助言もしくは推奨であることを意図したものではなく、またこれらに該当するものでもありません。詳細は利用規約をご覧ください。