MHIDa Crest Blow-Off Detector
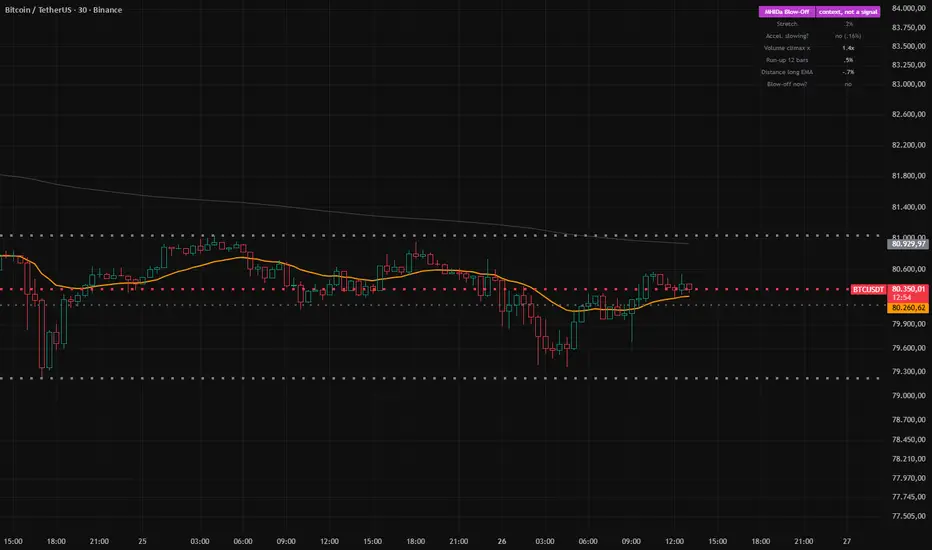
Crest Blow-Off Detector is a context overlay that highlights parabolic blow-off conditions: moments when price has stretched extremely far above its short moving average while the upward acceleration is starting to fade. It is a chart-reading aid, not a signal and not financial advice.
WHAT IT DOES
It marks the bar (triangle, label and light background) when two conditions are true together, and shows a small context panel on the last bar.
HOW IT IS CALCULATED (all values use only closed bars)
1) Extreme stretch: highest close of the last N bars (default 5) divided by the EMA (default 20), minus 1. If this exceeds the threshold (default 8%), the move counts as a blow-off stretch.
2) Fading acceleration: the latest 3-bar rise, close minus close[3], is compared with the previous 3-bar rise, close[3] minus close[6]. When the second push is weaker than the first (the difference, divided by close[6], is below zero), the parabola is losing thrust. This filter can be switched off.
3) Context panel (informational only): volume climax (highest volume of the last 5 bars divided by the 20-bar average volume), run-up over a chosen number of bars, and the distance of price from a long EMA (default 200).
WHY THESE PARTS ARE TOGETHER
Stretch alone only says price is far from its average, which can persist during strong trends. Adding the slowing-acceleration check asks whether the push is already weakening, so the highlight appears at the point where an extended move shows less thrust. The panel values help you judge how extreme the situation is.
HOW TO USE IT
Add it to any chart, then adjust the inputs (EMA lengths, peak window, stretch threshold, whether to require slowing acceleration) and study how the highlights behave on your own symbols and timeframes. Use it together with your own analysis. An alert condition is included if you want to be notified when a highlight appears. Markers are only drawn on standard chart types (not Heikin Ashi, Renko, Kagi, Point and Figure or Range).
NOTES
The default values are an educational starting point, not an optimized configuration. No performance or success rate is claimed or implied. Written in Pine Script v6.
WHAT IT DOES
It marks the bar (triangle, label and light background) when two conditions are true together, and shows a small context panel on the last bar.
HOW IT IS CALCULATED (all values use only closed bars)
1) Extreme stretch: highest close of the last N bars (default 5) divided by the EMA (default 20), minus 1. If this exceeds the threshold (default 8%), the move counts as a blow-off stretch.
2) Fading acceleration: the latest 3-bar rise, close minus close[3], is compared with the previous 3-bar rise, close[3] minus close[6]. When the second push is weaker than the first (the difference, divided by close[6], is below zero), the parabola is losing thrust. This filter can be switched off.
3) Context panel (informational only): volume climax (highest volume of the last 5 bars divided by the 20-bar average volume), run-up over a chosen number of bars, and the distance of price from a long EMA (default 200).
WHY THESE PARTS ARE TOGETHER
Stretch alone only says price is far from its average, which can persist during strong trends. Adding the slowing-acceleration check asks whether the push is already weakening, so the highlight appears at the point where an extended move shows less thrust. The panel values help you judge how extreme the situation is.
HOW TO USE IT
Add it to any chart, then adjust the inputs (EMA lengths, peak window, stretch threshold, whether to require slowing acceleration) and study how the highlights behave on your own symbols and timeframes. Use it together with your own analysis. An alert condition is included if you want to be notified when a highlight appears. Markers are only drawn on standard chart types (not Heikin Ashi, Renko, Kagi, Point and Figure or Range).
NOTES
The default values are an educational starting point, not an optimized configuration. No performance or success rate is claimed or implied. Written in Pine Script v6.

免責事項
これらの情報および投稿は、TradingViewが提供または承認する金融、投資、取引、またはその他の種類の助言もしくは推奨であることを意図したものではなく、またこれらに該当するものでもありません。詳細は利用規約をご覧ください。
免責事項
これらの情報および投稿は、TradingViewが提供または承認する金融、投資、取引、またはその他の種類の助言もしくは推奨であることを意図したものではなく、またこれらに該当するものでもありません。詳細は利用規約をご覧ください。