MTF Trend Dashboard
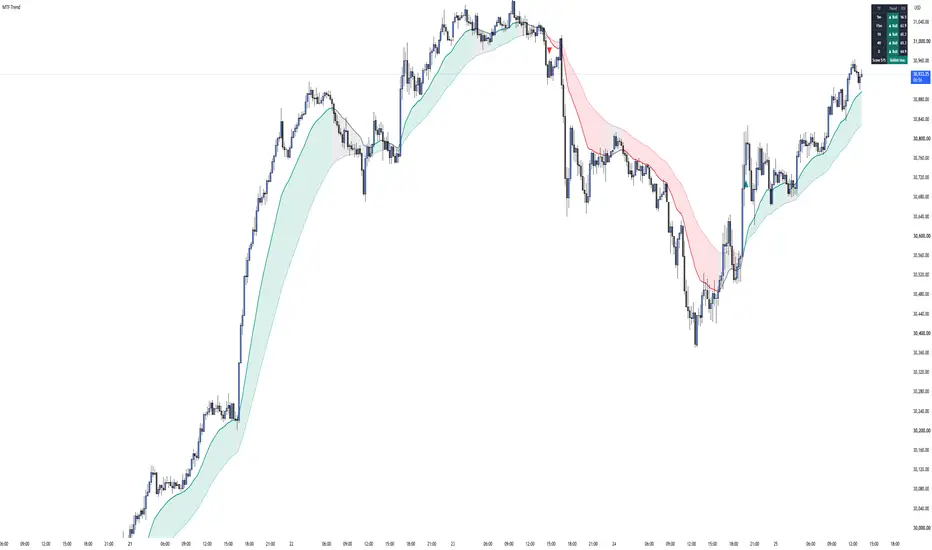
MTF Trend Dashboard shows the trend of five timeframes in one table, so you can check multi-timeframe alignment without switching charts.
How it works:
Each timeframe is classified as:
- Bullish: price above the fast EMA, fast EMA above the slow EMA, and RSI above 50
- Bearish: price below the fast EMA, fast EMA below the slow EMA, and RSI below 50
- Neutral: anything else
The Score row adds all timeframes together (from -5 to +5) and shows an overall bias.
On the chart:
- Fast and slow EMA with a cloud colored by the current trend
- Optional triangles for EMA crossovers
Alerts:
- Bullish / bearish EMA cross
- All timeframes bullish / bearish
Settings:
All EMA lengths, RSI length, the five timeframes, and the table position and size can be changed.
Note: this is a trend-analysis tool, not a trading signal or financial advice. Values on higher timeframes update in real time and can change until the higher-timeframe bar closes.
How it works:
Each timeframe is classified as:
- Bullish: price above the fast EMA, fast EMA above the slow EMA, and RSI above 50
- Bearish: price below the fast EMA, fast EMA below the slow EMA, and RSI below 50
- Neutral: anything else
The Score row adds all timeframes together (from -5 to +5) and shows an overall bias.
On the chart:
- Fast and slow EMA with a cloud colored by the current trend
- Optional triangles for EMA crossovers
Alerts:
- Bullish / bearish EMA cross
- All timeframes bullish / bearish
Settings:
All EMA lengths, RSI length, the five timeframes, and the table position and size can be changed.
Note: this is a trend-analysis tool, not a trading signal or financial advice. Values on higher timeframes update in real time and can change until the higher-timeframe bar closes.

免責事項
これらの情報および投稿は、TradingViewが提供または承認する金融、投資、取引、またはその他の種類の助言もしくは推奨であることを意図したものではなく、またこれらに該当するものでもありません。詳細は利用規約をご覧ください。
免責事項
これらの情報および投稿は、TradingViewが提供または承認する金融、投資、取引、またはその他の種類の助言もしくは推奨であることを意図したものではなく、またこれらに該当するものでもありません。詳細は利用規約をご覧ください。