アップデート済
Guppy Multiple Moving Average (GMMA) Scaled
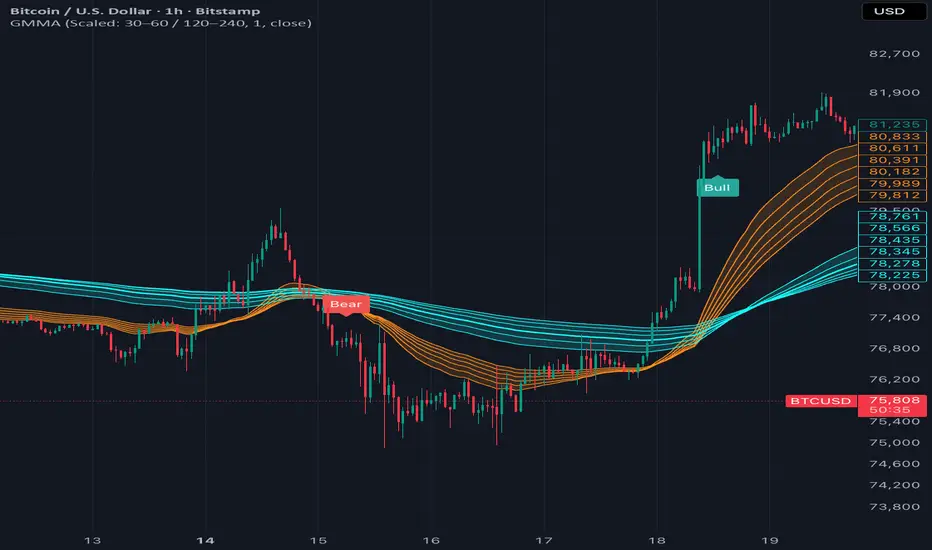
My version of Daryl Guppy's GMMA. It draws two groups of six exponential moving averages: a short group (orange) for short-term trading activity and a long group (cyan) for the longer-term trend. Read it the way Guppy intended: by where the two groups sit relative to each other, and how tightly each group is bunched.
What is different from the classic GMMA
Limitations
What is different from the classic GMMA
- Scaled periods (default). I use GMMA mostly on intraday charts of markets that trade around the clock, where the classic lengths are too short. The short group is 30, 36, 42, 48, 54, 60, and the long group is the same six lengths × 4 (120 … 240), so the long group is an exact stretched copy of the short one. On a 1h chart of a 24/7 market the 168 EMA spans exactly one week, so it is drawn thicker as a reference line.
- Classic preset. The standard Guppy periods (3–15 and 30–60) are one setting away.
- Period multiplier. Scales all twelve lengths, to carry the same structure to another timeframe.
- Group bands. Each group is shaded between its highest and lowest EMA, so compression and expansion are visible at a glance.
- Full-separation labels and alerts. "Bull" marks the bar where the lowest short EMA closes above the highest long EMA, meaning the whole short group has cleared the whole long group. "Bear" is the mirror case. This is stricter than a single pair of lines crossing. It is my addition, not part of Guppy's method, which reads the groups through compression and spacing rather than crossovers.
Limitations
- Labels and alerts are confirmed on bar close, so they appear one bar-close after the move, not mid-bar.
- No labels are drawn until the longest EMA has warmed up (240 bars at the default settings).
- Separations are a description of trend structure, not a trading system, and they lag by construction.
リリースノート
My version of Daryl Guppy's GMMA. It draws two groups of six exponential moving averages: a short group (orange) for short-term trading activity and a long group (cyan) for the longer-term trend. Read it the way Guppy intended: by where the two groups sit relative to each other, and how tightly each group is bunched. I've used this tool for years. What is different from the classic GMMA
- Scaled periods (default). I use GMMA mostly on intraday charts of markets that trade around the clock, where the classic lengths are too short. The short group is 30, 36, 42, 48, 54, 60, and the long group is the same six lengths × 4 (120 … 240), so the long group is an exact stretched copy of the short one. On a 1h chart of a 24/7 market the 168 EMA spans exactly one week, so it is drawn thicker as a reference line.
- Classic preset. The standard Guppy periods (3–15 and 30–60) are one setting away.
- Period multiplier. Scales all twelve lengths, to carry the same structure to another timeframe.
- Group bands. Each group is shaded between its highest and lowest EMA, so compression and expansion are visible at a glance.
- Full-separation labels and alerts. "Bull" marks the bar where the lowest short EMA closes above the highest long EMA, meaning the whole short group has cleared the whole long group. "Bear" is the mirror case. This is stricter than a single pair of lines crossing. It is my addition, not part of Guppy's method, which reads the groups through compression and spacing rather than crossovers.
Limitations
- Labels and alerts are confirmed on bar close, so they appear one bar-close after the move, not mid-bar.
- No labels are drawn until the longest EMA has warmed up (240 bars at the default settings).
- Separations are a description of trend structure, not a trading system, and they lag by construction.
リリースノート
Trying to correct the screenshot. 
免責事項
これらの情報および投稿は、TradingViewが提供または承認する金融、投資、取引、またはその他の種類の助言もしくは推奨であることを意図したものではなく、またこれらに該当するものでもありません。詳細は利用規約をご覧ください。
免責事項
これらの情報および投稿は、TradingViewが提供または承認する金融、投資、取引、またはその他の種類の助言もしくは推奨であることを意図したものではなく、またこれらに該当するものでもありません。詳細は利用規約をご覧ください。