OPEN-SOURCE SCRIPT
Trend Alignment Ribbon - Multi Timeframe Moving Averages
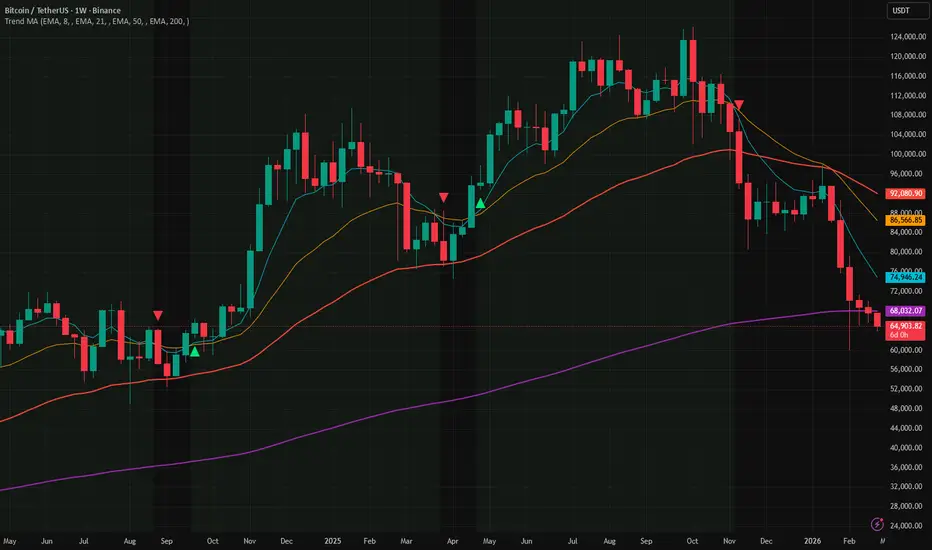
Track trend direction across multiple timeframes — all in one view.
Trend trading works best when the short, medium, and long-term views all agree. This indicator places four moving averages on your chart simultaneously and highlights the moment they fall into full alignment — giving you a simple, visual confirmation that a trend is in control.
──── What You're Looking At ────
Four smooth lines on your chart, each tracking price at a different speed:
──── How to Read It ────
──── Multi-Timeframe Mode ────
Each of the four lines can be pinned to a different timeframe, independent of the chart you are on. For example, while viewing a 15-minute chart you can display the 200-bar average as it appears on the daily chart — so the big picture is always visible.
Leave the Timeframe field blank to use the current chart's timeframe (default behaviour).
──── Settings ────
Each moving average has its own settings group (Moving Average 1–4):
Under Visuals:
──── Alerts ────
──── Tips ────
Trend trading works best when the short, medium, and long-term views all agree. This indicator places four moving averages on your chart simultaneously and highlights the moment they fall into full alignment — giving you a simple, visual confirmation that a trend is in control.
──── What You're Looking At ────
Four smooth lines on your chart, each tracking price at a different speed:
- MA1 (fastest, default: 8 bars) — reacts quickly to price. The first line to turn when momentum shifts.
- MA2 (default: 21 bars) — short-to-intermediate direction. Confirms or challenges what MA1 is saying.
- MA3 (default: 50 bars) — the medium-term trend backbone. Widely watched by institutions.
- MA4 (slowest, default: 200 bars) — the long-term trend anchor. The most important line on most charts.
──── How to Read It ────
- Green background — all four lines are stacked in order, fastest on top. The trend is strongly up. High-confidence environment for long trades.
- Red background — all four lines are stacked in reverse order. The trend is strongly down. High-confidence environment for short trades.
- No background — the lines are tangled or out of order. The market is ranging or in transition. Reduce risk or wait for clarity.
- Triangle up ▲ below a candle — the fast line just crossed above the medium line. Early momentum shift to the upside.
- Triangle down ▼ above a candle — the fast line just crossed below the medium line. Early momentum shift to the downside.
──── Multi-Timeframe Mode ────
Each of the four lines can be pinned to a different timeframe, independent of the chart you are on. For example, while viewing a 15-minute chart you can display the 200-bar average as it appears on the daily chart — so the big picture is always visible.
Leave the Timeframe field blank to use the current chart's timeframe (default behaviour).
──── Settings ────
Each moving average has its own settings group (Moving Average 1–4):
- Show — toggle each line on or off independently.
- Type — choose between four calculation methods:
- EMA (Exponential) — reacts faster to recent price. Most commonly used. Default.
- SMA (Simple) — a plain average of all bars. Slower to react, widely respected by institutions.
- WMA (Weighted) — middle ground, heavier weight on recent bars.
- HMA (Hull) — very fast and smooth. Minimises lag while reducing noise.
- Length — how many bars are included in the average. Higher number = slower, smoother line.
- Timeframe — leave blank for the current chart. Enter 1D for daily, 1W for weekly, 4H for four-hour, etc.
- Color — fully customisable per line.
Under Visuals:
- Ribbon Fill — fills the space between MA1 and MA4 with a transparent green or red shade. Useful for seeing trend strength at a glance.
- Alignment Background — highlights the chart background when all 4 lines agree on direction. On by default.
- Cross Signals — places small triangle markers on the chart when MA1 and MA2 cross. On by default.
──── Alerts ────
- MA Bull Cross — the fast line crossed above the medium line
- MA Bear Cross — the fast line crossed below the medium line
- Full Bull Alignment — all 4 lines just entered bullish order for the first time
- Full Bear Alignment — all 4 lines just entered bearish order for the first time
──── Tips ────
- Set an alert for Full Alignment — these moments often mark the start of the strongest, cleanest trend moves on any instrument.
- A cross signal that fires while the alignment background is already lit is a higher-confidence entry than a cross signal in a mixed or choppy environment.
- A "tight stack" of closely spaced lines means the trend is young and orderly. Wide spacing with tangled lines means the market is extended or breaking down — not an ideal entry point.
- On intraday charts, try pinning MA3 or MA4 to the daily timeframe. This keeps your long-term bias anchored without switching charts.
- All timeframe calculations use confirmed (closed) bars only — there is no repainting.
オープンソーススクリプト
TradingViewの精神に則り、このスクリプトの作者はコードをオープンソースとして公開してくれました。トレーダーが内容を確認・検証できるようにという配慮です。作者に拍手を送りましょう!無料で利用できますが、コードの再公開はハウスルールに従う必要があります。

免責事項
これらの情報および投稿は、TradingViewが提供または承認する金融、投資、取引、またはその他の種類の助言もしくは推奨であることを意図したものではなく、またこれらに該当するものでもありません。詳細は利用規約をご覧ください。
オープンソーススクリプト
TradingViewの精神に則り、このスクリプトの作者はコードをオープンソースとして公開してくれました。トレーダーが内容を確認・検証できるようにという配慮です。作者に拍手を送りましょう!無料で利用できますが、コードの再公開はハウスルールに従う必要があります。
免責事項
これらの情報および投稿は、TradingViewが提供または承認する金融、投資、取引、またはその他の種類の助言もしくは推奨であることを意図したものではなく、またこれらに該当するものでもありません。詳細は利用規約をご覧ください。