OPEN-SOURCE SCRIPT
更新済 AG Pro Donchian Breakout Quality [AGPro Series]
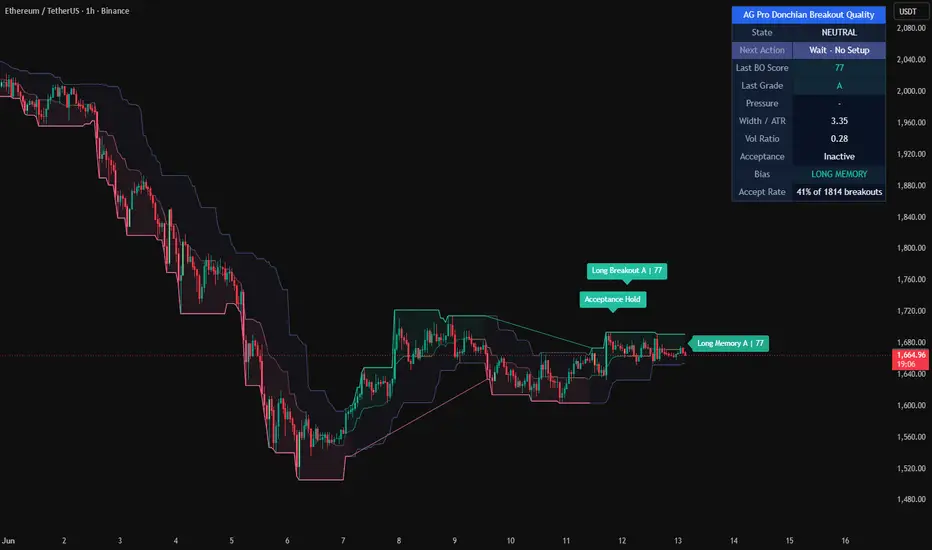
AG Pro Donchian Breakout Quality [AGPro Series]
Overview / What it does
AG Pro Donchian Breakout Quality is an overlay indicator built around a simple but practical question: not every Donchian breakout carries the same informational quality, so how can that difference be visualized directly on the chart? Instead of treating every channel escape as equally meaningful, this script evaluates the structure of the breakout bar, the local channel condition, and the immediate follow-through context, then converts that information into a readable breakout quality framework. The goal is not to predict the future or to classify markets with certainty. The goal is to help the user separate cleaner breakouts from weaker ones inside a familiar Donchian channel structure.
The indicator plots the Donchian upper band, lower band, optional midline, and channel fill, then adds a quality layer on top of the raw channel logic. When price closes through the previous Donchian boundary, the script evaluates the event and assigns a score. That score is then mapped to a simple grade scale so the breakout can be read quickly without losing access to the underlying channel context. This creates a workflow that remains visually intuitive for users who already understand Donchian channels, while adding a more structured interpretation layer for breakout review.
A second focus of the script is post-breakout behavior. In practice, many breakouts are not decided by the break itself, but by what price does after the first expansion bar. For that reason, the indicator tracks an active breakout level, projects a retest zone around that level using ATR, and monitors whether price can hold that area. This makes the tool useful not only for identifying fresh breaks, but also for observing whether the market is accepting or rejecting the newly crossed boundary.
The visual design is intentionally chart-first. The channel remains the primary frame, while breakout labels, retest markers, level tags, the setup tag, and the compact state panel provide context without turning the script into a crowded dashboard. Historical label clutter is reduced by default, and the script is designed so the most recent relevant structure remains readable on active charts.
Unique Edge
The distinctive feature of this script is that it does not stop at “price broke the channel.” Traditional Donchian usage often leaves the interpretation step entirely to the user. This script keeps the Donchian framework intact, but adds an explicit breakout quality model. That means the script is not merely showing an upper-band break or lower-band break; it is also evaluating how that break occurred.
The quality model scores breakouts using multiple components rather than a single threshold. It considers breakout distance relative to ATR, breakout candle body participation, wick behavior, local channel compression, midline slope context, and optional volume confirmation. This matters because many weak breakouts can look similar to stronger ones at first glance, especially when the user is reviewing charts quickly. By ranking the event instead of only flagging it, the indicator introduces a more disciplined read on the same familiar Donchian concept.
Another differentiator is the breakout-to-retest workflow. The script identifies the breakout, stores the active level, builds a retest zone around that level, and then tracks hold behavior within a limited life window. This makes the indicator less about a one-bar event and more about the structural sequence that often matters in live chart reading: approach, break, test, hold, or fail. That sequence is especially helpful for users who do not want a Donchian tool to act like a simple channel overlay with occasional arrows.
The presentation layer is also part of the edge. Active-side emphasis, breakout shelf visualization, level tagging, a right-side setup tag, state detection, and selective event marking are included to help the chart communicate context more clearly. The script is therefore positioned as a Donchian breakout interpretation tool, not as a generic channel plotter.
Methodology
The script starts with a standard Donchian channel calculation using the selected lookback length. The highest high defines the upper boundary, the lowest low defines the lower boundary, and the midpoint between them forms the optional midline. A breakout is detected when the current close moves beyond the previous upper boundary for a bullish event, or beyond the previous lower boundary for a bearish event.
Once a breakout is detected, the script calculates a quality score. The score is built from multiple normalized components. Breakout distance measures how far the close extends beyond the prior Donchian boundary relative to ATR. Candle body participation rewards bars where the real body contributes meaningfully to the range. Wick behavior penalizes less efficient breakout bars. Midline slope acts as a directional context proxy. Channel compression evaluates whether the breakout is emerging from a relatively tighter local structure. Volume, when enabled, adds an additional confirmation layer by comparing current volume to a moving average baseline.
These components are weighted and combined into a single breakout quality score. The result is then translated into a grade scale: A+, A, B, C, or D. This grade is not a claim about trade outcome, and it is not a guarantee of continuation. It is a structured description of breakout quality according to the internal model used by the script.
After the breakout, the indicator records the active breakout level and projects a retest zone around it using ATR-based half-width logic. This active zone remains visible for a user-defined number of bars. During that window, the script monitors whether price revisits the zone and holds it according to the directional logic. When a valid hold occurs, the script can mark that event on the chart. If price invalidates the zone, the active state is cleared.
The panel summarizes the current state and the most recent breakout evaluation. Depending on chart context, the script can display conditions such as Long Breakout, Short Breakout, active retest states, watch states, or Neutral. It also reports the latest breakout score, grade, channel width relative to ATR, and the current volume ratio when volume confirmation is enabled.
Signals & Alerts
The script includes deterministic alert conditions tied to specific structural events rather than vague descriptive states.
Long Breakout
Triggered when price closes above the previous upper Donchian boundary.
Short Breakout
Triggered when price closes below the previous lower Donchian boundary.
Long Retest Hold
Triggered when a bullish breakout remains active and price revisits the retest zone without losing the active breakout level according to the script’s hold logic.
Short Retest Hold
Triggered when a bearish breakout remains active and price revisits the retest zone without reclaiming the active breakout level according to the script’s hold logic.
These alerts are event-based and intended to describe what the script detects on the chart. They are not trade instructions, and they should not be interpreted as a complete execution plan on their own.
Key Inputs
Donchian Length
Controls the lookback used for the channel boundaries.
ATR Length
Used in the quality model and for retest zone construction.
Midline Slope Lookback
Defines how the script measures midline slope for directional context.
Use Volume Confirmation / Volume SMA Length
Enables or disables the volume component and sets the averaging baseline.
Break Distance Full-Score ATR
Defines how far beyond the channel price must extend to receive a full distance score.
Channel Width Full-Penalty ATR
Controls how channel width contributes to the compression component.
Watch Threshold
Helps identify when price is approaching the upper or lower channel region.
Retest Zone Life / Retest Half-Width ATR
Sets how long the active retest zone remains valid and how wide it is.
Minimum Score For Breakout Labels
Helps reduce noise by showing breakout labels only above the chosen threshold.
Label and Panel Controls
Allow adjustment of label visibility, historical label behavior, label size, label shift, panel position, and panel font size.
Visual Style Controls
Enable or disable edge glow, breakout level tags, right-side setup tag, breakout shelf, and event candle tint.
Limitations & Transparency
This indicator is an analytical overlay, not a strategy, not an execution engine, and not a backtest report. It does not place orders, size positions, manage risk, or estimate expected return. A high breakout score does not mean price must continue, and a low breakout score does not mean reversal is guaranteed. The score only reflects how the breakout ranks according to the script’s internal weighting model.
Donchian logic is inherently sensitive to lookback selection and market regime. A shorter channel can produce more frequent events and more noise, while a longer channel can reduce event frequency and delay signals. Volume-based confirmation also depends on the instrument and session structure. On some symbols, volume can be informative; on others, it may be less useful.
Retest logic is also contextual. Not every breakout will retest, not every retest will be clean, and not every valid hold will produce meaningful continuation. The retest zone is an interpretive tool designed to help chart reading, not a universal rule set for all instruments or timeframes.
The visual elements are intended to improve readability, but users may still want to tune label thresholds, style controls, and retest settings to fit their own workflow. As with any chart tool, results can vary across assets, volatility regimes, and timeframes.
Risk Disclosure
This script is for chart analysis and educational use. It is not financial advice, not investment advice, and not a promise of future performance. Markets can move unpredictably, and breakout structures can fail without warning. Any trading or investment decision should be made using independent judgment, personal risk controls, and additional confirmation where appropriate.
Overview / What it does
AG Pro Donchian Breakout Quality is an overlay indicator built around a simple but practical question: not every Donchian breakout carries the same informational quality, so how can that difference be visualized directly on the chart? Instead of treating every channel escape as equally meaningful, this script evaluates the structure of the breakout bar, the local channel condition, and the immediate follow-through context, then converts that information into a readable breakout quality framework. The goal is not to predict the future or to classify markets with certainty. The goal is to help the user separate cleaner breakouts from weaker ones inside a familiar Donchian channel structure.
The indicator plots the Donchian upper band, lower band, optional midline, and channel fill, then adds a quality layer on top of the raw channel logic. When price closes through the previous Donchian boundary, the script evaluates the event and assigns a score. That score is then mapped to a simple grade scale so the breakout can be read quickly without losing access to the underlying channel context. This creates a workflow that remains visually intuitive for users who already understand Donchian channels, while adding a more structured interpretation layer for breakout review.
A second focus of the script is post-breakout behavior. In practice, many breakouts are not decided by the break itself, but by what price does after the first expansion bar. For that reason, the indicator tracks an active breakout level, projects a retest zone around that level using ATR, and monitors whether price can hold that area. This makes the tool useful not only for identifying fresh breaks, but also for observing whether the market is accepting or rejecting the newly crossed boundary.
The visual design is intentionally chart-first. The channel remains the primary frame, while breakout labels, retest markers, level tags, the setup tag, and the compact state panel provide context without turning the script into a crowded dashboard. Historical label clutter is reduced by default, and the script is designed so the most recent relevant structure remains readable on active charts.
Unique Edge
The distinctive feature of this script is that it does not stop at “price broke the channel.” Traditional Donchian usage often leaves the interpretation step entirely to the user. This script keeps the Donchian framework intact, but adds an explicit breakout quality model. That means the script is not merely showing an upper-band break or lower-band break; it is also evaluating how that break occurred.
The quality model scores breakouts using multiple components rather than a single threshold. It considers breakout distance relative to ATR, breakout candle body participation, wick behavior, local channel compression, midline slope context, and optional volume confirmation. This matters because many weak breakouts can look similar to stronger ones at first glance, especially when the user is reviewing charts quickly. By ranking the event instead of only flagging it, the indicator introduces a more disciplined read on the same familiar Donchian concept.
Another differentiator is the breakout-to-retest workflow. The script identifies the breakout, stores the active level, builds a retest zone around that level, and then tracks hold behavior within a limited life window. This makes the indicator less about a one-bar event and more about the structural sequence that often matters in live chart reading: approach, break, test, hold, or fail. That sequence is especially helpful for users who do not want a Donchian tool to act like a simple channel overlay with occasional arrows.
The presentation layer is also part of the edge. Active-side emphasis, breakout shelf visualization, level tagging, a right-side setup tag, state detection, and selective event marking are included to help the chart communicate context more clearly. The script is therefore positioned as a Donchian breakout interpretation tool, not as a generic channel plotter.
Methodology
The script starts with a standard Donchian channel calculation using the selected lookback length. The highest high defines the upper boundary, the lowest low defines the lower boundary, and the midpoint between them forms the optional midline. A breakout is detected when the current close moves beyond the previous upper boundary for a bullish event, or beyond the previous lower boundary for a bearish event.
Once a breakout is detected, the script calculates a quality score. The score is built from multiple normalized components. Breakout distance measures how far the close extends beyond the prior Donchian boundary relative to ATR. Candle body participation rewards bars where the real body contributes meaningfully to the range. Wick behavior penalizes less efficient breakout bars. Midline slope acts as a directional context proxy. Channel compression evaluates whether the breakout is emerging from a relatively tighter local structure. Volume, when enabled, adds an additional confirmation layer by comparing current volume to a moving average baseline.
These components are weighted and combined into a single breakout quality score. The result is then translated into a grade scale: A+, A, B, C, or D. This grade is not a claim about trade outcome, and it is not a guarantee of continuation. It is a structured description of breakout quality according to the internal model used by the script.
After the breakout, the indicator records the active breakout level and projects a retest zone around it using ATR-based half-width logic. This active zone remains visible for a user-defined number of bars. During that window, the script monitors whether price revisits the zone and holds it according to the directional logic. When a valid hold occurs, the script can mark that event on the chart. If price invalidates the zone, the active state is cleared.
The panel summarizes the current state and the most recent breakout evaluation. Depending on chart context, the script can display conditions such as Long Breakout, Short Breakout, active retest states, watch states, or Neutral. It also reports the latest breakout score, grade, channel width relative to ATR, and the current volume ratio when volume confirmation is enabled.
Signals & Alerts
The script includes deterministic alert conditions tied to specific structural events rather than vague descriptive states.
Long Breakout
Triggered when price closes above the previous upper Donchian boundary.
Short Breakout
Triggered when price closes below the previous lower Donchian boundary.
Long Retest Hold
Triggered when a bullish breakout remains active and price revisits the retest zone without losing the active breakout level according to the script’s hold logic.
Short Retest Hold
Triggered when a bearish breakout remains active and price revisits the retest zone without reclaiming the active breakout level according to the script’s hold logic.
These alerts are event-based and intended to describe what the script detects on the chart. They are not trade instructions, and they should not be interpreted as a complete execution plan on their own.
Key Inputs
Donchian Length
Controls the lookback used for the channel boundaries.
ATR Length
Used in the quality model and for retest zone construction.
Midline Slope Lookback
Defines how the script measures midline slope for directional context.
Use Volume Confirmation / Volume SMA Length
Enables or disables the volume component and sets the averaging baseline.
Break Distance Full-Score ATR
Defines how far beyond the channel price must extend to receive a full distance score.
Channel Width Full-Penalty ATR
Controls how channel width contributes to the compression component.
Watch Threshold
Helps identify when price is approaching the upper or lower channel region.
Retest Zone Life / Retest Half-Width ATR
Sets how long the active retest zone remains valid and how wide it is.
Minimum Score For Breakout Labels
Helps reduce noise by showing breakout labels only above the chosen threshold.
Label and Panel Controls
Allow adjustment of label visibility, historical label behavior, label size, label shift, panel position, and panel font size.
Visual Style Controls
Enable or disable edge glow, breakout level tags, right-side setup tag, breakout shelf, and event candle tint.
Limitations & Transparency
This indicator is an analytical overlay, not a strategy, not an execution engine, and not a backtest report. It does not place orders, size positions, manage risk, or estimate expected return. A high breakout score does not mean price must continue, and a low breakout score does not mean reversal is guaranteed. The score only reflects how the breakout ranks according to the script’s internal weighting model.
Donchian logic is inherently sensitive to lookback selection and market regime. A shorter channel can produce more frequent events and more noise, while a longer channel can reduce event frequency and delay signals. Volume-based confirmation also depends on the instrument and session structure. On some symbols, volume can be informative; on others, it may be less useful.
Retest logic is also contextual. Not every breakout will retest, not every retest will be clean, and not every valid hold will produce meaningful continuation. The retest zone is an interpretive tool designed to help chart reading, not a universal rule set for all instruments or timeframes.
The visual elements are intended to improve readability, but users may still want to tune label thresholds, style controls, and retest settings to fit their own workflow. As with any chart tool, results can vary across assets, volatility regimes, and timeframes.
Risk Disclosure
This script is for chart analysis and educational use. It is not financial advice, not investment advice, and not a promise of future performance. Markets can move unpredictably, and breakout structures can fail without warning. Any trading or investment decision should be made using independent judgment, personal risk controls, and additional confirmation where appropriate.
リリースノート
UPDATE NOTES - V1.1This update focuses on visual refinement and chart readability.
The goal of this revision is not to redefine Donchian breakout logic, alter the scoring framework, or reframe the script as a prediction engine. Instead, the update improves the way breakout quality information is presented on the chart so that active conditions are easier to read at a glance while preserving the original rules-based structure of the tool.
What changed in this update:
• Breakout and quality labels were cleaned up into a more compact single-line presentation.
• Label placement was refined to reduce overlap between breakout, retest, and right-side status tags.
• Channel edge rendering was softened by reducing line weight for a more polished chart appearance.
• Focus lines and highlighted visual elements were made slimmer so the chart remains readable during extended viewing.
• The visual hierarchy between the channel, active context, and labels was improved to reduce clutter.
• The overall presentation was tuned to make the script feel cleaner and more deliberate without changing its analytical purpose.
What did not change:
• No change to Donchian channel construction.
• No change to breakout qualification logic.
• No change to breakout quality score calculation.
• No change to retest detection logic.
• No change to the documented alert conditions or their intended meaning.
In practical terms, this version is a presentation-oriented refinement. It is designed to make breakout-quality context easier to interpret on live charts while keeping the script aligned with its original purpose: organizing Donchian breakouts, breakout quality, and retest behavior in a structured way.
As always, this script is intended as a chart-organization and decision-support tool. It should be used in context and not as a standalone basis for trade decisions.
リリースノート
Update Notes (V1.3)This update focuses on visual clarity, chart balance, and panel consistency without changing the core Donchian breakout / retest concept.
What changed in this update:
- Refined the chart presentation so candles remain easier to read during active channel and zone display.
- Reduced the visual intensity of channel fills and support visuals to keep price action more visible.
- Softened the Donchian boundary lines and related visual rails for a cleaner overlay.
- Adjusted zone transparency so the script remains informative without dominating the chart.
- Improved the placement of the active setup tag on the right side for better balance and less empty spacing.
- Standardized the panel header into a single merged first row with the script name only.
- Applied the updated AG Pro panel structure with a blue header row and cleaner table organization.
- Kept the default panel font size at Small and the default label size at Normal for better chart usability.
- Preserved the breakout quality, retest tracking, and panel state workflow while refining the overall visual experience.
Notes:
- This release is primarily a presentation and usability refinement.
- The script remains an analysis and alerting tool, not an automated trading system.
- Signals and grades should still be evaluated in the context of market structure, volatility, and user confirmation rules.
リリースノート
Update Notes - V1.5This update refines Donchian Breakout Quality with a cleaner structure, stronger chart presence, and more informative state tracking.
- Added a new Pressure Map to highlight repeated compression near the upper or lower Donchian boundary before confirmed breakouts.
- Added Watch and Memory tags so charts remain more informative even when no active acceptance phase is present.
- Refined the Acceptance Zone and Launch Shelf workflow for clearer post-breakout structure and cleaner visual follow-through.
- Improved breakout labeling so moderate-quality breakouts are represented more consistently without overcrowding the chart.
- Reworked panel presentation, spacing, and tooltip copy for a more polished and readable TradingView experience.
- Kept the logic focused on confirmed breakout quality, acceptance behavior, channel context, and efficient on-chart visibility.
This release is designed to make the script easier to read across different symbols and timeframes while preserving a clean premium layout.
リリースノート
🔧 UPDATE NOTES - v1.6This update focuses on decision clarity and readability.
The core purpose of the script remains unchanged.
This release improves how the existing breakout engine is presented, organized, and interpreted on the chart.
This script continues to function as an analytical and visualization tool.
It does not attempt to predict price direction or provide guaranteed outcomes.
------------------------
What Changed
------------------------
• New "Next Action" panel readout
The panel now translates the current breakout state into a plain-language focus line: "Track Long / Short Breakout" on a confirmed escape, "Hold Bias - Long / Short Accepted" once the breakout base is accepted, "Watch Long / Short Break" during an active pressure zone, "Wait - Near Upper / Lower Edge" on a watch approach, and "Wait - No Setup" when neutral. The dashboard can be read at a glance without decoding raw values.
• New "Accept Rate" historical statistic
The panel can now display the share of confirmed breakouts on the current chart that produced an acceptance hold before failing or expiring. The statistic is built directly on the existing acceptance lifecycle, is measured from confirmed bars, is purely descriptive, and can be hidden from the Panel settings. Past behavior does not guarantee future outcomes.
------------------------
Visual Improvements
------------------------
• Refined panel visual hierarchy: the Next Action row is highlighted so the current focus stands out at first glance
• Improved panel information flow from state, to focus, to score and grade, to pressure and acceptance context
• No changes to the Donchian channel, edge glow, focus rail, midline, channel fill, pressure zones, acceptance zone, launch shelf, breakout base line, event tints, or any on-chart tags and labels - the established chart presentation is preserved exactly
• Default visual settings remain balanced; existing user settings are preserved
------------------------
Interface & Usability
------------------------
• Optimized panel layout (State -> Next Action -> Last BO Score -> Last Grade -> Pressure -> Width/ATR -> Vol Ratio -> Acceptance -> Bias -> Accept Rate)
• Added a dedicated setting to show or hide the Accept Rate statistic
• Enhanced overall user experience without changing core logic
------------------------
Behavior Notes
------------------------
This update does not change the core analytical logic of the script.
The Donchian engine, pressure map, breakout quality scoring, acceptance lifecycle, labels, tags, and alert conditions are identical to v1.5.
Users should interpret outputs the same way as before, but with improved reading order and added historical context.
------------------------
Limitations Reminder
------------------------
The script remains a rule-based analytical tool.
Market conditions such as volatility, liquidity, and timeframe differences may affect how breakouts, acceptance, and the Accept Rate statistic appear.
Outputs should always be interpreted within broader market context.
------------------------
Risk Reminder
------------------------
This script is for educational and analytical purposes only.
It does not provide financial advice or guaranteed trading outcomes.
Users remain responsible for their own decisions.
オープンソーススクリプト
TradingViewの精神に則り、このスクリプトの作者はコードをオープンソースとして公開してくれました。トレーダーが内容を確認・検証できるようにという配慮です。作者に拍手を送りましょう!無料で利用できますが、コードの再公開はハウスルールに従う必要があります。

🧠 Trading Suite - Flagship Workflow
tradingview.com/script/XJmX3p98-Trading-Suite-AGPro-Series/
🔷 Crypto Setup Planner - Multi-Symbol Planner
tradingview.com/script/LgVRo7Ql-Crypto-Setup-Planner-AGPro-Series/
tradingview.com/script/XJmX3p98-Trading-Suite-AGPro-Series/
🔷 Crypto Setup Planner - Multi-Symbol Planner
tradingview.com/script/LgVRo7Ql-Crypto-Setup-Planner-AGPro-Series/
免責事項
これらの情報および投稿は、TradingViewが提供または承認する金融、投資、取引、またはその他の種類の助言もしくは推奨であることを意図したものではなく、またこれらに該当するものでもありません。詳細は利用規約をご覧ください。
オープンソーススクリプト
TradingViewの精神に則り、このスクリプトの作者はコードをオープンソースとして公開してくれました。トレーダーが内容を確認・検証できるようにという配慮です。作者に拍手を送りましょう!無料で利用できますが、コードの再公開はハウスルールに従う必要があります。
🧠 Trading Suite - Flagship Workflow
tradingview.com/script/XJmX3p98-Trading-Suite-AGPro-Series/
🔷 Crypto Setup Planner - Multi-Symbol Planner
tradingview.com/script/LgVRo7Ql-Crypto-Setup-Planner-AGPro-Series/
tradingview.com/script/XJmX3p98-Trading-Suite-AGPro-Series/
🔷 Crypto Setup Planner - Multi-Symbol Planner
tradingview.com/script/LgVRo7Ql-Crypto-Setup-Planner-AGPro-Series/
免責事項
これらの情報および投稿は、TradingViewが提供または承認する金融、投資、取引、またはその他の種類の助言もしくは推奨であることを意図したものではなく、またこれらに該当するものでもありません。詳細は利用規約をご覧ください。