OPEN-SOURCE SCRIPT
更新済 Cross-Timeframe Value Overlay [AGPro Series]
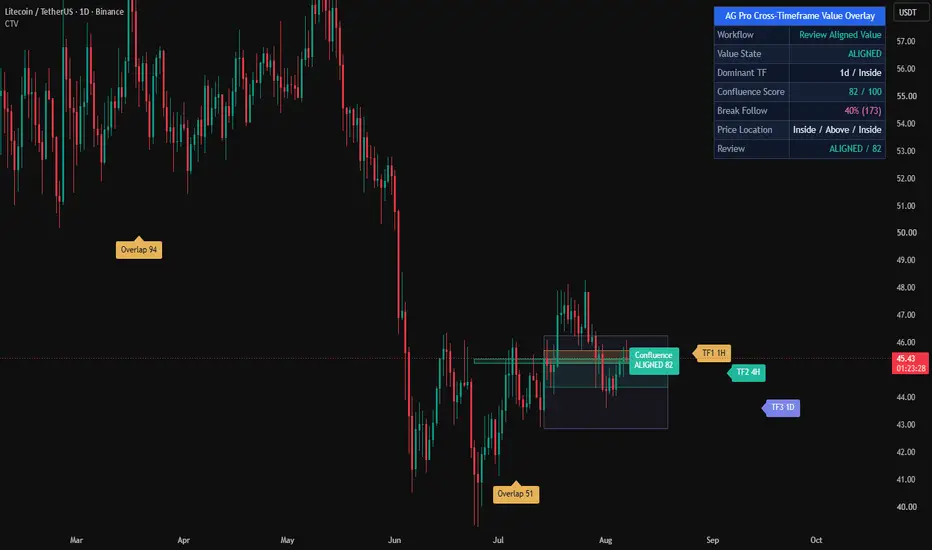
Cross-Timeframe Value Overlay [AGPro Series]
🔷 Overview
Cross-Timeframe Value Overlay projects up to three independent rolling value
bands — one per selected higher timeframe — onto a single chart. Each band
marks the region where price has been accepted on that timeframe over a
configurable lookback window, built from a volume-weighted or mean-based
anchor surrounded by an ATR envelope. A built-in state engine then classifies
the relationship between bands in real time as ALIGNED, OVERLAP, CONFLICT or
NEUTRAL, so multi-timeframe context becomes readable in a single glance.
🔷 What Makes This Different
Most multi-timeframe scripts stack indicators or draw fixed HTF pivots. This
tool builds a *rolling* value envelope on each timeframe and then compares
them structurally rather than numerically.
• Three independent MTF value bands on one chart, each with its own lookback
context and ATR-sized width.
• Dedicated state engine with four discrete regimes — ALIGNED / OVERLAP /
CONFLICT / NEUTRAL — based on pairwise band geometry, not on raw price.
• Dynamic z-order rendering that automatically draws the slowest timeframe
behind faster ones, and an opacity hierarchy that keeps the slowest band
lightest and the fastest band darkest. Larger structures frame smaller
ones instead of obscuring them.
• Rank-based label placement that prevents collisions when bands overlap in
price, so labels remain readable even during OVERLAP or ALIGNED states.
• Box width adaptively capped so a Daily band cannot swallow a 1H chart.
• Dominant-TF tracking that always reports the highest enabled timeframe and
the price position relative to its band.
🔷 Methodology
For each enabled timeframe the script computes:
• Anchor = VWAP (volume-weighted HLC3) over the rolling window, or HLC3 SMA
when volume data is unreliable.
• Half = ATR(window) multiplied by the configured band-width factor.
• Band = [anchor + half, anchor − half].
Values are requested with lookahead disabled, so historical band positions
reflect only data that was available at the time.
The state engine then evaluates:
• Pairwise overlap — do any two bands share a price region?
• Alignment — are all enabled band centers clustered within a strictness
threshold (Loose 1.2 ATR / Standard 0.8 ATR / Strict 0.4 ATR) of their
mean?
• Disjoint count — how many pairs are fully separated?
These three checks map deterministically to one of four states on every bar.
🔷 Signals and Alerts
Three built-in alert conditions cover the most useful MTF transitions:
• Value Overlap Detected — a new pairwise overlap forms between any two
enabled timeframes.
• Higher-Timeframe Value Lost — price leaves the dominant HTF value band
after being inside it on the previous bar.
• Cross-Timeframe Conflict — the state engine transitions into CONFLICT,
indicating that at least one enabled pair of bands has become fully
disjoint.
All alerts are wired as alertcondition() entries so they can be combined
with the standard TradingView alert workflow.
🔷 Key Inputs
• Timeframes — enable/disable up to three HTFs and pick any resolution for
each (defaults 1H / 4H / Daily).
• Rolling Window — 10 to 500 bars for the anchor and ATR.
• Band Width — 0.25 to 3.0 ATR half-width.
• Anchor Method — VWAP + ATR or HLC3 MA + ATR.
• Alignment Strictness — Loose, Standard or Strict threshold for the state
engine.
• Show Only Overlapping Bands — hides isolated bands to keep confluence
zones visible.
• Visuals — per-TF color, base opacity, right-edge label toggle, label font
size.
• Panel — position, font size and master visibility switch.
🔷 How to Use
• Read the state first. ALIGNED = all enabled timeframes agree on a common
value region; OVERLAP = partial confluence; CONFLICT = disjoint
timeframes; NEUTRAL = fewer than two active bands or indeterminate.
• Read the Dominant row to see which timeframe currently carries the most
structural weight.
• Read the per-TF rows to locate price as Above / Inside / Below each band.
• Combine the three in a single pass: for example, price Above a dominant
HTF band while the state is CONFLICT is a very different context from
price Inside an ALIGNED stack.
• Pair with your existing entry framework (breakout, mean-reversion, order
flow, trend-following) — this tool is a context layer, not an entry
signal generator.
🔷 Limitations and Transparency
• Box-based rendering is capped at three concurrent bands by design to keep
the chart readable.
• All values are computed with lookahead disabled. Bands update when the
corresponding HTF bar closes, which is the expected behavior for any MTF
tool.
• Volume-weighted anchoring depends on the quality of the instrument's
volume feed; on markets with unreliable volume, switch to the HLC3 MA
method.
• This script is an analytical overlay. It is not a strategy, does not
produce buy/sell signals, and makes no forecasting claim.
🔷 Risk Disclosure
Trading involves substantial risk. This indicator is provided for research
and educational purposes only and does not constitute financial advice.
Past market behavior does not guarantee future results. Always perform your
own due diligence and use proper risk management.
Open-source under Mozilla Public License 2.0.
🔷 Overview
Cross-Timeframe Value Overlay projects up to three independent rolling value
bands — one per selected higher timeframe — onto a single chart. Each band
marks the region where price has been accepted on that timeframe over a
configurable lookback window, built from a volume-weighted or mean-based
anchor surrounded by an ATR envelope. A built-in state engine then classifies
the relationship between bands in real time as ALIGNED, OVERLAP, CONFLICT or
NEUTRAL, so multi-timeframe context becomes readable in a single glance.
🔷 What Makes This Different
Most multi-timeframe scripts stack indicators or draw fixed HTF pivots. This
tool builds a *rolling* value envelope on each timeframe and then compares
them structurally rather than numerically.
• Three independent MTF value bands on one chart, each with its own lookback
context and ATR-sized width.
• Dedicated state engine with four discrete regimes — ALIGNED / OVERLAP /
CONFLICT / NEUTRAL — based on pairwise band geometry, not on raw price.
• Dynamic z-order rendering that automatically draws the slowest timeframe
behind faster ones, and an opacity hierarchy that keeps the slowest band
lightest and the fastest band darkest. Larger structures frame smaller
ones instead of obscuring them.
• Rank-based label placement that prevents collisions when bands overlap in
price, so labels remain readable even during OVERLAP or ALIGNED states.
• Box width adaptively capped so a Daily band cannot swallow a 1H chart.
• Dominant-TF tracking that always reports the highest enabled timeframe and
the price position relative to its band.
🔷 Methodology
For each enabled timeframe the script computes:
• Anchor = VWAP (volume-weighted HLC3) over the rolling window, or HLC3 SMA
when volume data is unreliable.
• Half = ATR(window) multiplied by the configured band-width factor.
• Band = [anchor + half, anchor − half].
Values are requested with lookahead disabled, so historical band positions
reflect only data that was available at the time.
The state engine then evaluates:
• Pairwise overlap — do any two bands share a price region?
• Alignment — are all enabled band centers clustered within a strictness
threshold (Loose 1.2 ATR / Standard 0.8 ATR / Strict 0.4 ATR) of their
mean?
• Disjoint count — how many pairs are fully separated?
These three checks map deterministically to one of four states on every bar.
🔷 Signals and Alerts
Three built-in alert conditions cover the most useful MTF transitions:
• Value Overlap Detected — a new pairwise overlap forms between any two
enabled timeframes.
• Higher-Timeframe Value Lost — price leaves the dominant HTF value band
after being inside it on the previous bar.
• Cross-Timeframe Conflict — the state engine transitions into CONFLICT,
indicating that at least one enabled pair of bands has become fully
disjoint.
All alerts are wired as alertcondition() entries so they can be combined
with the standard TradingView alert workflow.
🔷 Key Inputs
• Timeframes — enable/disable up to three HTFs and pick any resolution for
each (defaults 1H / 4H / Daily).
• Rolling Window — 10 to 500 bars for the anchor and ATR.
• Band Width — 0.25 to 3.0 ATR half-width.
• Anchor Method — VWAP + ATR or HLC3 MA + ATR.
• Alignment Strictness — Loose, Standard or Strict threshold for the state
engine.
• Show Only Overlapping Bands — hides isolated bands to keep confluence
zones visible.
• Visuals — per-TF color, base opacity, right-edge label toggle, label font
size.
• Panel — position, font size and master visibility switch.
🔷 How to Use
• Read the state first. ALIGNED = all enabled timeframes agree on a common
value region; OVERLAP = partial confluence; CONFLICT = disjoint
timeframes; NEUTRAL = fewer than two active bands or indeterminate.
• Read the Dominant row to see which timeframe currently carries the most
structural weight.
• Read the per-TF rows to locate price as Above / Inside / Below each band.
• Combine the three in a single pass: for example, price Above a dominant
HTF band while the state is CONFLICT is a very different context from
price Inside an ALIGNED stack.
• Pair with your existing entry framework (breakout, mean-reversion, order
flow, trend-following) — this tool is a context layer, not an entry
signal generator.
🔷 Limitations and Transparency
• Box-based rendering is capped at three concurrent bands by design to keep
the chart readable.
• All values are computed with lookahead disabled. Bands update when the
corresponding HTF bar closes, which is the expected behavior for any MTF
tool.
• Volume-weighted anchoring depends on the quality of the instrument's
volume feed; on markets with unreliable volume, switch to the HLC3 MA
method.
• This script is an analytical overlay. It is not a strategy, does not
produce buy/sell signals, and makes no forecasting claim.
🔷 Risk Disclosure
Trading involves substantial risk. This indicator is provided for research
and educational purposes only and does not constitute financial advice.
Past market behavior does not guarantee future results. Always perform your
own due diligence and use proper risk management.
Open-source under Mozilla Public License 2.0.
リリースノート
UPDATE NOTES - V1.5This update focuses on readability, visual structure, chart clarity, and usability.
The core purpose of the script remains unchanged.
This release improves how the existing cross-timeframe value logic is presented, organized, and interpreted on the chart.
This script continues to function as an analytical and visualization tool.
It does not attempt to predict price direction or provide guaranteed outcomes.
------------------------
What Changed
------------------------
* Refined the publication identity
The script title now follows the updated AGPro Series naming standard while the panel title keeps the AG Pro brand format.
* Added a centered confluence zone
When two or more timeframe value bands overlap, the shared value area can now be highlighted with a centered label inside the zone.
* Added a 0-100 confluence score
The script now summarizes center agreement, band overlap, and price location into a readable score shown in the panel and live tag.
* Added a live right-edge state tag
The current value state and confluence score now remain visible near the right edge of the chart.
* Added panel theme control
The panel now supports Dark and Light themes while keeping the standard single merged blue header row.
* Improved label density control
Minimal, Balanced, and Detailed modes help control how much annotation appears on the chart.
------------------------
Visual Improvements
------------------------
* Improved chart readability by giving the shared value area a clear centered label.
* Reduced right-edge label overlap by staggering timeframe tags according to their vertical rank.
* Moved the live value-state tag outside the visible band stack so it does not overlap timeframe tags.
* Refined visual hierarchy so timeframe bands, confluence zone, live tag, and panel each serve a separate purpose.
* Adjusted defaults so the chart has visible context without becoming crowded.
* Improved value-band presentation with stronger opacity hierarchy across fast, mid, and slow timeframes.
------------------------
Interface & Usability
------------------------
* Rebuilt the panel with the standard single merged blue header row.
* Added configurable panel position, panel theme, panel font size, and label font size.
* Added a Show Panel toggle that remains enabled by default.
* Added separate toggles for value bands, confluence zone, timeframe tags, and live state tag.
* Reorganized the panel into State, Action, Dominant, Score, Price vs TFs, and Overlaps.
* Added clearer professional English tooltips for the updated controls.
------------------------
Behavior Notes
------------------------
This update does not change the core analytical purpose of the script.
The rolling value-band concept remains the same: selected higher timeframes generate accepted-value bands, and the script evaluates their relationship.
The goal is to improve clarity and usability, not to introduce predictive behavior.
Users should interpret outputs the same way as before, but with better confluence context and stronger visual structure.
------------------------
Limitations Reminder
------------------------
The script remains a rule-based analytical tool.
Market conditions such as low liquidity, unusual volatility, timeframe mismatch, and unreliable volume data may affect how value bands appear.
Outputs should always be interpreted within broader market context.
------------------------
Risk Reminder
------------------------
This script is for educational and analytical purposes only.
It does not provide financial advice or guaranteed trading outcomes.
Users remain responsible for their own decisions.
リリースノート
UPDATE NOTES - V1.6This update focuses on readability, panel flow, label spacing, and cross-timeframe value interpretation.
The core purpose of the script remains unchanged.
This release improves how the existing higher-timeframe value overlay logic is presented, organized, and interpreted on the chart.
This script continues to function as an analytical and visualization tool.
It does not attempt to predict price direction or provide guaranteed outcomes.
------------------------
What Changed
------------------------
* Reworked the panel into a clearer dashboard flow.
The panel now prioritizes workflow, value state, dominant timeframe, confluence score, price location, and review context.
* Expanded panel controls.
The panel now supports show/hide, dark/light theme, font-size control, and nine selectable chart locations, including center anchors.
* Refined cross-timeframe value storytelling.
The confluence zone keeps a centered premium badge, while timeframe tags and event labels provide cleaner first-glance context.
* Improved overlap-zone continuity.
When the selected timeframes create pairwise overlap without a clean three-way intersection, the chart now highlights the strongest shared value area instead of leaving the overlap story visually empty.
* Added controlled event labels.
Aligned value, new overlap, conflict, and dominant-value-lost events can now print as spaced chart labels away from candle bodies.
* Reduced right-edge crowding.
The live state tag is optional and disabled by default so the panel, timeframe tags, and centered confluence badge remain easier to read.
* Adjusted default visual weight.
Higher default band transparency, shorter right projection, and slower event-label repetition keep higher-timeframe boxes readable without overpowering the active chart.
* Refined confluence badge placement.
The centered confluence badge is now biased toward the forward side of the value zone so it remains readable when candles cluster around the active overlap.
------------------------
Visual Improvements
------------------------
* Improved chart readability by tightening projection length, tag spacing, and label density defaults.
* Reduced visual clutter while keeping enough labels and zone context for publication screenshots.
* Moderated repeated event badges so the chart does not become dominated by one event type.
* Raised event-label spacing and quality filters to keep historical labels meaningful rather than repetitive.
* Refined visual hierarchy so the shared value area, dominant timeframe context, and overlap state stand out more clearly.
* Adjusted label placement so important event labels appear above or below candles instead of being buried inside candle clusters.
* Updated visible chart label casing so premium badges and tags read as chart labels rather than lowercase technical slugs.
------------------------
Interface & Usability
------------------------
* Optimized panel layout for faster interpretation of multi-timeframe value context.
* Improved label readability with one shared chart label-size control.
* Adjusted default visual settings for a more balanced, premium appearance.
* Preserved the single blue merged panel header with the script name only.
------------------------
Behavior Notes
------------------------
This update does not change the core analytical logic of the script.
The same higher-timeframe VWAP or HLC3 value bands, ATR-based band width, overlap logic, dominant timeframe logic, and confluence score remain in place.
The goal is to improve clarity and usability, not to introduce new predictive behavior.
Users should interpret outputs the same way as before, but with improved visual structure.
------------------------
Limitations Reminder
------------------------
The script remains a rule-based analytical tool.
Market conditions such as volatility, liquidity, symbol behavior, and timeframe selection may affect how value bands and overlap states appear.
Outputs should always be interpreted within broader market context.
------------------------
Risk Reminder
------------------------
This script is for educational and analytical purposes only.
It does not provide financial advice or guaranteed trading outcomes.
Users remain responsible for their own decisions.
リリースノート
UPDATE NOTES - 1.10This update focuses on confluence badge readability and candle-safe chart placement.
The core purpose of the script remains unchanged.
This release improves how the confluence label sits inside the projected value zone.
This script continues to function as an analytical and visualization tool.
It does not attempt to predict price direction or provide guaranteed outcomes.
------------------------
What Changed
------------------------
* Candle-safe confluence badge
The confluence badge now anchors into the forward projection area instead of sitting over the recent candle cluster.
* Cleaner zone labeling
The confluence label remains inside the zone, but it is moved away from active price bars for better first-glance readability.
* Preserved timeframe tag placement
TF1, TF2, and TF3 right-edge tags keep the near-edge placement introduced in V1.9.
------------------------
Visual Improvements
------------------------
* Improved chart readability by separating confluence text from active candles.
* Reduced overlap between the confluence badge, candles, and compact value-band areas.
* Refined visual hierarchy so the confluence zone remains labeled without crowding the price action.
------------------------
Behavior Notes
------------------------
This update does not change the core analytical logic of the script.
The value band calculation, confluence scoring, overlap detection, panel values, and alerts remain unchanged.
------------------------
Risk Reminder
------------------------
This script is for educational and analytical purposes only.
It does not provide financial advice or guaranteed trading outcomes.
Users remain responsible for their own decisions.
リリースノート
🔧 UPDATE NOTES - v1.11This update adds a dominant-value break follow-through proof and a small contrast fix.
The core purpose of the script remains unchanged.
It continues to project multiple higher-timeframe accepted-value bands and classify whether
value is aligned, overlapping, conflicting, or neutral across timeframes.
This script continues to function as an analytical and visualization tool.
It does not attempt to predict price direction or provide guaranteed outcomes.
------------------------
What Changed
------------------------
- Break Follow Rate proof layer
The panel now reports how often a Dominant Value Lost break historically followed through in
the exit direction rather than snapping back into the band, shown with the sample count.
- Break follow proof window input
A new setting controls the window used to measure post-break follow-through.
- Honest, conservative counting
Each break is counted once, and a re-entry into the band or a window expiry without follow-
through is treated as a not-followed, so the rate stays realistic on the selected market.
------------------------
Visual Improvements
------------------------
- Fixed timeframe-tag text contrast so every tag stays readable on its color, including the
amber fast-timeframe tag on light backgrounds
- Kept the value bands, confluence zone and centered confluence badge unchanged
- Maintained collision-aware tag placement and balanced label density
- Preserved a clean, uncluttered first-glance read
------------------------
Interface & Usability
------------------------
- Added a Break Follow row for an at-a-glance break follow-through track record
- Added a window setting so the proof measures prompt follow-through
- Kept the workflow, value state, dominant timeframe, score and location hierarchy
- Enhanced overall user experience without changing the core value logic
------------------------
Behavior Notes
------------------------
This update does not change the core analytical logic of the script.
The value bands, alignment states, dominant timeframe and confluence score are unchanged. The
Break Follow Rate is a separate historical track-record layer and does not alter detection.
------------------------
Limitations Reminder
------------------------
The script remains a rule-based analytical tool.
Market conditions such as volatility, liquidity and timeframe differences may affect how
value states, bands and the rate appear.
Outputs should always be interpreted within broader market context.
------------------------
Risk Reminder
------------------------
This script is for educational and analytical purposes only.
It does not provide financial advice or guaranteed trading outcomes.
Users remain responsible for their own decisions.
リリースノート
Version 1.13 – Confluence and Timeframe Tag ClearanceThis update completes the right-edge visual separation introduced in Version 1.12. The analytical model, value bands, confluence calculations, historical event logic, panel, inputs, and alerts remain unchanged.
• Moved the complete TF1–TF3 tag ladder five additional bars to the right, creating clear breathing room between the centered Confluence badge and the first timeframe tag.
• Preserved the established density-aware spacing between TF1, TF2, and TF3 so the timeframe labels remain individually readable when value bands converge.
• Kept every timeframe tag anchored to the true vertical level of its own value band; the update changes horizontal presentation only.
• Retained the centered Confluence badge, premium color hierarchy, historical label density, and existing chart interpretation without adding predictive behavior.
オープンソーススクリプト
TradingViewの精神に則り、このスクリプトの作者はコードをオープンソースとして公開してくれました。トレーダーが内容を確認・検証できるようにという配慮です。作者に拍手を送りましょう!無料で利用できますが、コードの再公開はハウスルールに従う必要があります。

🧠 Trading Suite - Flagship Workflow
tradingview.com/script/XJmX3p98-Trading-Suite-AGPro-Series/
🔷 Crypto Setup Planner - Multi-Symbol Planner
tradingview.com/script/LgVRo7Ql-Crypto-Setup-Planner-AGPro-Series/
tradingview.com/script/XJmX3p98-Trading-Suite-AGPro-Series/
🔷 Crypto Setup Planner - Multi-Symbol Planner
tradingview.com/script/LgVRo7Ql-Crypto-Setup-Planner-AGPro-Series/
免責事項
これらの情報および投稿は、TradingViewが提供または承認する金融、投資、取引、またはその他の種類の助言もしくは推奨であることを意図したものではなく、またこれらに該当するものでもありません。詳細は利用規約をご覧ください。
オープンソーススクリプト
TradingViewの精神に則り、このスクリプトの作者はコードをオープンソースとして公開してくれました。トレーダーが内容を確認・検証できるようにという配慮です。作者に拍手を送りましょう!無料で利用できますが、コードの再公開はハウスルールに従う必要があります。
🧠 Trading Suite - Flagship Workflow
tradingview.com/script/XJmX3p98-Trading-Suite-AGPro-Series/
🔷 Crypto Setup Planner - Multi-Symbol Planner
tradingview.com/script/LgVRo7Ql-Crypto-Setup-Planner-AGPro-Series/
tradingview.com/script/XJmX3p98-Trading-Suite-AGPro-Series/
🔷 Crypto Setup Planner - Multi-Symbol Planner
tradingview.com/script/LgVRo7Ql-Crypto-Setup-Planner-AGPro-Series/
免責事項
これらの情報および投稿は、TradingViewが提供または承認する金融、投資、取引、またはその他の種類の助言もしくは推奨であることを意図したものではなく、またこれらに該当するものでもありません。詳細は利用規約をご覧ください。