OPEN-SOURCE SCRIPT
Volume & Volatility Companion
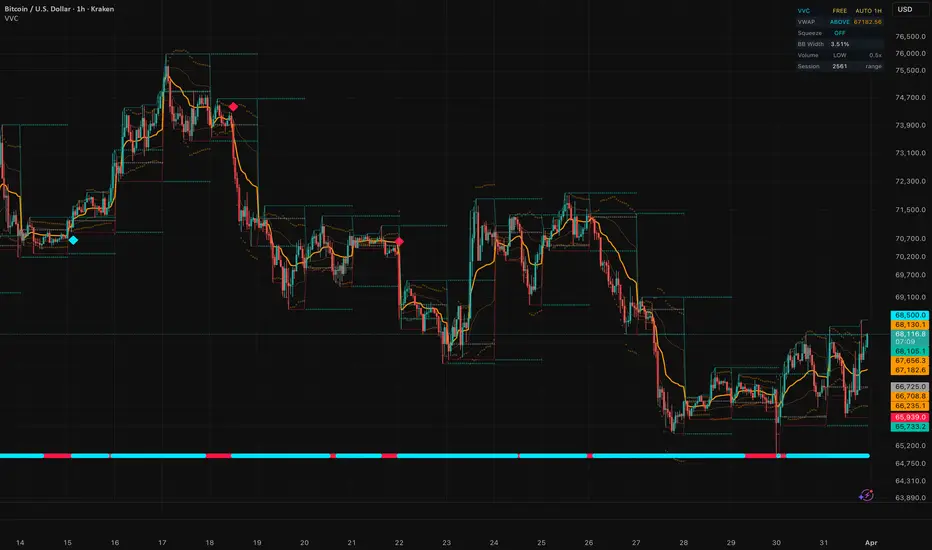
█ VOLUME & VOLATILITY COMPANION (VVC) [FREE]
Complete Volume Dynamics & Volatility Analysis
A comprehensive overlay indicator that combines anchored VWAP with standard-deviation bands, Bollinger Squeeze detection, volume strength analysis, and session level tracking — all with automatic timeframe adaptation. It gives you a complete read on volume dynamics and volatility conditions directly on your price chart.
Free and Open Source.
█ THE CONCEPT: WHY VOLUME + VOLATILITY TOGETHER?
Volume and volatility are the two most overlooked edges in technical analysis. Price alone only tells half the story. Volume confirms conviction — a breakout on high volume is real, on low volume it's suspect. Volatility compression (squeeze) precedes explosive moves. VVC brings both dimensions together in one overlay so you never miss these critical signals.
█ CORE FEATURES
1. VWAP + Standard Deviation Bands
The Volume-Weighted Average Price acts as the institutional fair-value anchor:
Configurable anchor period: Session (daily), Week, or Month.
2. Bollinger Squeeze Detection
Detects the classic volatility compression setup where Bollinger Bands contract inside Keltner Channels:
Momentum direction at release determines the breakout bias.
3. Volume Analysis
Classifies each bar's volume relative to its moving average:
4. Session Levels
Key reference levels plotted directly on the chart:
5. Auto-Timeframe Adaptation
All calculation parameters automatically adjust to your chart timeframe. Toggle to manual mode for full control.
█ DASHBOARD
A compact, dark-themed info panel showing:
█ ALERTS (4 CONDITIONS)
█ PRO VERSION
The PRO version adds:
█ NON-REPAINTING
VWAP uses cumulative volume data (non-repainting by design). Bollinger Squeeze uses standard BB/KC calculations. Volume analysis uses simple moving average. Previous day levels use confirmed daily data. No repainting.
█ WORKS ON
Crypto, Forex, Stocks, Futures, Indices — any timeframe from 1 minute to Weekly+.
█ DISCLAIMER
This indicator is for educational and informational purposes only. It does not constitute financial advice. Always do your own research and manage your risk. Past performance does not guarantee future results. Trading involves substantial risk of loss.
Complete Volume Dynamics & Volatility Analysis
A comprehensive overlay indicator that combines anchored VWAP with standard-deviation bands, Bollinger Squeeze detection, volume strength analysis, and session level tracking — all with automatic timeframe adaptation. It gives you a complete read on volume dynamics and volatility conditions directly on your price chart.
Free and Open Source.
█ THE CONCEPT: WHY VOLUME + VOLATILITY TOGETHER?
Volume and volatility are the two most overlooked edges in technical analysis. Price alone only tells half the story. Volume confirms conviction — a breakout on high volume is real, on low volume it's suspect. Volatility compression (squeeze) precedes explosive moves. VVC brings both dimensions together in one overlay so you never miss these critical signals.
█ CORE FEATURES
1. VWAP + Standard Deviation Bands
The Volume-Weighted Average Price acts as the institutional fair-value anchor:
- VWAP Line — Dynamic equilibrium price. Institutions track this level religiously.
- Band 1 (1 StdDev) — Inner value zone. Mean-reversion entries when price touches and bounces.
- Band 2 (2 StdDev) — Outer extreme zone. Overextension signals when price reaches here.
Configurable anchor period: Session (daily), Week, or Month.
2. Bollinger Squeeze Detection
Detects the classic volatility compression setup where Bollinger Bands contract inside Keltner Channels:
- Squeeze ON (red dots) — BB inside KC = low volatility, energy building
- Squeeze OFF (cyan dots) — Normal volatility
- Squeeze Release (diamond markers) — BB breaks out of KC after sustained compression = breakout imminent
Momentum direction at release determines the breakout bias.
3. Volume Analysis
Classifies each bar's volume relative to its moving average:
- EXTREME — Volume > 2.5x average (institutional footprint)
- HIGH — Volume > 1.5x average (above-average interest)
- NORMAL — Average range
- LOW — Volume < 0.5x average (thin market, low conviction)
4. Session Levels
Key reference levels plotted directly on the chart:
- Session High/Low — Current intraday range boundaries
- Previous Day High/Low — Breakout/rejection levels
- Previous Day Close — Settlement level (bias reference)
5. Auto-Timeframe Adaptation
All calculation parameters automatically adjust to your chart timeframe. Toggle to manual mode for full control.
█ DASHBOARD
A compact, dark-themed info panel showing:
- VWAP — Current position (ABOVE / BELOW / AT) + value
- Squeeze — ON with bar count or OFF
- BB Width — Percentage bandwidth for volatility context
- Volume — Classification (EXTREME / HIGH / NORMAL / LOW) + ratio vs MA
- Session — Current session range in price units
█ ALERTS (4 CONDITIONS)
- Bullish Squeeze Release — Squeeze fires with upward momentum
- Bearish Squeeze Release — Squeeze fires with downward momentum
- Squeeze Building — Consecutive squeeze bars hit threshold
- Extreme Volume — Detected on any bar
█ PRO VERSION
The PRO version adds:
- MACD Analysis — Full MACD with signal/zero crossovers and divergence detection
- Cumulative Volume Delta (CVD) — Net buying/selling pressure tracking
- Bull/Bear Confluence Scoring — Combined score from all modules for directional bias
- 5 Additional Alerts — MACD crosses, volume confirmation signals
█ NON-REPAINTING
VWAP uses cumulative volume data (non-repainting by design). Bollinger Squeeze uses standard BB/KC calculations. Volume analysis uses simple moving average. Previous day levels use confirmed daily data. No repainting.
█ WORKS ON
Crypto, Forex, Stocks, Futures, Indices — any timeframe from 1 minute to Weekly+.
█ DISCLAIMER
This indicator is for educational and informational purposes only. It does not constitute financial advice. Always do your own research and manage your risk. Past performance does not guarantee future results. Trading involves substantial risk of loss.
オープンソーススクリプト
TradingViewの精神に則り、このスクリプトの作者はコードをオープンソースとして公開してくれました。トレーダーが内容を確認・検証できるようにという配慮です。作者に拍手を送りましょう!無料で利用できますが、コードの再公開はハウスルールに従う必要があります。

👆More free indicators on my profile.
The complete PRO Suite — every indicator and strategy — in one subscription.
👉 alphachart.trade
The complete PRO Suite — every indicator and strategy — in one subscription.
👉 alphachart.trade
免責事項
これらの情報および投稿は、TradingViewが提供または承認する金融、投資、取引、またはその他の種類の助言もしくは推奨であることを意図したものではなく、またこれらに該当するものでもありません。詳細は利用規約をご覧ください。
オープンソーススクリプト
TradingViewの精神に則り、このスクリプトの作者はコードをオープンソースとして公開してくれました。トレーダーが内容を確認・検証できるようにという配慮です。作者に拍手を送りましょう!無料で利用できますが、コードの再公開はハウスルールに従う必要があります。
👆More free indicators on my profile.
The complete PRO Suite — every indicator and strategy — in one subscription.
👉 alphachart.trade
The complete PRO Suite — every indicator and strategy — in one subscription.
👉 alphachart.trade
免責事項
これらの情報および投稿は、TradingViewが提供または承認する金融、投資、取引、またはその他の種類の助言もしくは推奨であることを意図したものではなく、またこれらに該当するものでもありません。詳細は利用規約をご覧ください。