Drawdown Path With A Dip Buy & Exit Recovery Position
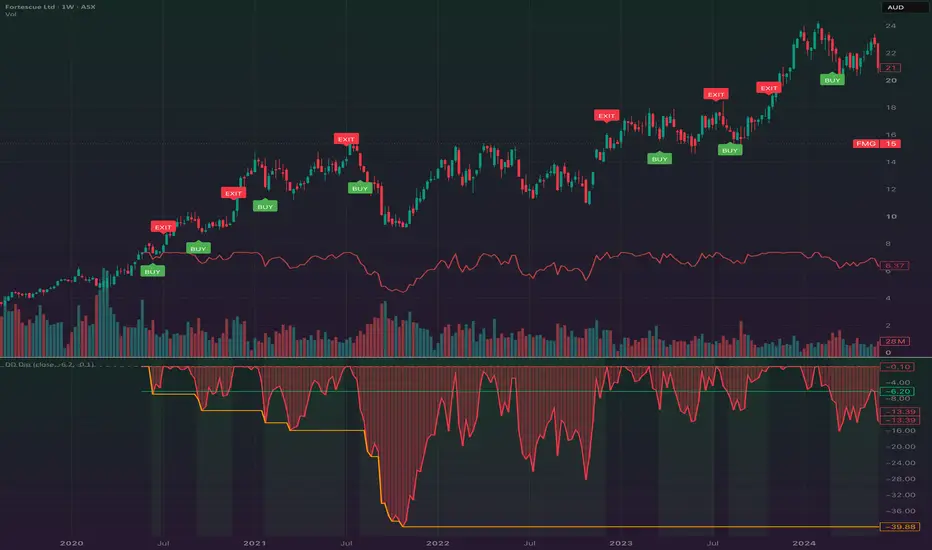
Understanding drawdown is an important part of managing risk and evaluating an investment’s path.
Many guides explain the concept, but I wanted a way to visualise drawdown for the security I’m charting and see how a simple buy-the-dip, exit-on-recovery rule behaves.
This is the alternative to Drawdown Path with a Defensive Exit & Re-entry.
Visualising the drawdown path

The indicator measures each selected price against its highest value since the chosen start date, using the chart history available.
With the default Close source, confirmed-bar drawdown is measured against the highest closing price over that period. At the tracked peak, drawdown is 0%; below it, drawdown is negative.
The drawdown path is also rescaled to the initial selected price and projected onto the main price chart.
In the settings, you can change the start date and compare how the path looks over different periods.
Below you will see, two images with very close start paths.
Notice how even a small change in the beginning location can have large implications for the drawdown.


The projected path is a visual representation of the asset’s drawdown, not a portfolio equity curve. It continues to move while the rule is in cash. The maximum-drawdown line also measures the asset’s drawdown, not the performance of the buy-and-exit rule.
Buying the decline and exiting the recovery
The script marks a simple buy-on-decline, exit-on-recovery rule. You can change the thresholds in the indicator settings or edit their defaults in the source:
Default Settings
Pine Script®
For this rule, the BUY threshold must be lower, or more negative, than the EXIT threshold: −6.2% triggers entry during a deeper drawdown, while −0.1% triggers an exit after recovery. In other words, buy further below the peak; exit closer to it.
Unlike the defensive version, the first active bar does not produce an automatic BUY. The script starts in cash and waits for the selected price to fall far enough below its tracked peak.
You can see this below.

While in cash, it marks a BUY when drawdown reaches −6.2% or becomes more negative. Once invested, it marks an EXIT when drawdown recovers to −0.1% or better.
Position changes occur only on confirmed bars, so an intrabar touch that reverses before the close does not trigger a signal.
The tracked peak does not reset after a trade. These percentages measure the asset’s distance below its tracked peak, not your gain or loss from the entry price.
What this rule does not protect against
This version waits for a defined decline rather than buying immediately, then holds for a defined recovery rather than trying to identify the exact bottom or top. That does not establish that the decline is temporary or that recovery will occur.
The EXIT threshold is a recovery target, not a stop-loss. If drawdown deepens after a BUY, the rule remains invested. A BUY at −6.2% does not prevent a later drawdown of −20%, −50% or more. There is no separate downside exit or time limit, so a position can remain open indefinitely if the required recovery never occurs.
This is a long-only, threshold-based exposure rule, not an offsetting hedge or a portfolio optimisation model. It alternates between a hypothetical invested state and cash.
Many guides explain the concept, but I wanted a way to visualise drawdown for the security I’m charting and see how a simple buy-the-dip, exit-on-recovery rule behaves.
This is the alternative to Drawdown Path with a Defensive Exit & Re-entry.
This is published separately to preserve the original defensive version for existing users. The original exits on weakness and re-enters after recovery; This version starts in cash, buys during a defined drawdown and exits after recovery. The drawdown calculation stays the same; the trading logic changes.
Visualising the drawdown path
The indicator measures each selected price against its highest value since the chosen start date, using the chart history available.
With the default Close source, confirmed-bar drawdown is measured against the highest closing price over that period. At the tracked peak, drawdown is 0%; below it, drawdown is negative.
The drawdown path is also rescaled to the initial selected price and projected onto the main price chart.
In the settings, you can change the start date and compare how the path looks over different periods.
Below you will see, two images with very close start paths.
Notice how even a small change in the beginning location can have large implications for the drawdown.
The projected path is a visual representation of the asset’s drawdown, not a portfolio equity curve. It continues to move while the rule is in cash. The maximum-drawdown line also measures the asset’s drawdown, not the performance of the buy-and-exit rule.
Buying the decline and exiting the recovery
The script marks a simple buy-on-decline, exit-on-recovery rule. You can change the thresholds in the indicator settings or edit their defaults in the source:
Default Settings
For this rule, the BUY threshold must be lower, or more negative, than the EXIT threshold: −6.2% triggers entry during a deeper drawdown, while −0.1% triggers an exit after recovery. In other words, buy further below the peak; exit closer to it.
Unlike the defensive version, the first active bar does not produce an automatic BUY. The script starts in cash and waits for the selected price to fall far enough below its tracked peak.
You can see this below.
While in cash, it marks a BUY when drawdown reaches −6.2% or becomes more negative. Once invested, it marks an EXIT when drawdown recovers to −0.1% or better.
Position changes occur only on confirmed bars, so an intrabar touch that reverses before the close does not trigger a signal.
With a tracked peak of $100 and Close selected as the source, the rule stays in cash until a bar closes at $93.80 or below. It then marks a BUY. If the price subsequently closes at $90, it keeps holding. If it later recovers to $99.90, it marks an EXIT. These are signal conditions, not guaranteed execution prices.
The tracked peak does not reset after a trade. These percentages measure the asset’s distance below its tracked peak, not your gain or loss from the entry price.
What this rule does not protect against
This version waits for a defined decline rather than buying immediately, then holds for a defined recovery rather than trying to identify the exact bottom or top. That does not establish that the decline is temporary or that recovery will occur.
The EXIT threshold is a recovery target, not a stop-loss. If drawdown deepens after a BUY, the rule remains invested. A BUY at −6.2% does not prevent a later drawdown of −20%, −50% or more. There is no separate downside exit or time limit, so a position can remain open indefinitely if the required recovery never occurs.
This is a long-only, threshold-based exposure rule, not an offsetting hedge or a portfolio optimisation model. It alternates between a hypothetical invested state and cash.
A drawdown tells you how far the price has fallen from its peak, not whether it has finished falling.

免責事項
これらの情報および投稿は、TradingViewが提供または承認する金融、投資、取引、またはその他の種類の助言もしくは推奨であることを意図したものではなく、またこれらに該当するものでもありません。詳細は利用規約をご覧ください。
免責事項
これらの情報および投稿は、TradingViewが提供または承認する金融、投資、取引、またはその他の種類の助言もしくは推奨であることを意図したものではなく、またこれらに該当するものでもありません。詳細は利用規約をご覧ください。