OPEN-SOURCE SCRIPT
更新済 MTF Stoch RSI Snapshot 9 Timeframe Overview
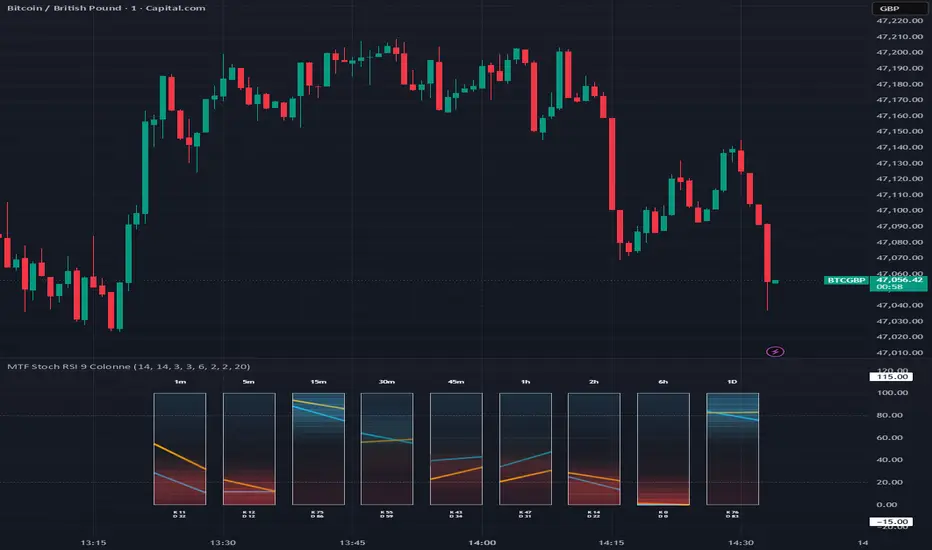
This indicator provides a compact multi-timeframe view of the Stochastic RSI across 9 different timeframes:
1m, 5m, 15m, 30m, 45m, 1h, 2h, 6h, 1D
Instead of switching between charts, the script displays all selected timeframes side by side in a clean column layout. Each column represents one timeframe and shows the current position of the two Stoch RSI lines, making it easier to quickly understand momentum conditions across multiple market structures.
Main Features
Multi-timeframe Stoch RSI visualization
9 fixed timeframe columns
K and D lines shown inside each column
Gradient background based on oscillator level
Quick visual identification of overbought and oversold areas
20 / 50 / 80 reference levels
Optional numeric K and D values
Compact layout designed for fast market reading
How to Read It
Each column represents a timeframe.
The vertical position of the lines shows where the Stoch RSI currently is:
Near the bottom: oversold / weak momentum area
Around the middle: neutral zone
Near the top: overbought / strong momentum area
The background gradient helps identify the oscillator zone immediately, while the two plotted lines allow you to see the current relationship between K and D.
This is useful when you want to compare short-term and higher-timeframe momentum at a glance.
Typical Use Cases
Scalping confirmation
Multi-timeframe momentum alignment
Spotting overbought / oversold conditions across timeframes
Filtering entries based on higher-timeframe context
Quickly checking whether short-term movement agrees with broader market structure
Notes
This indicator does not generate buy or sell signals by itself.
It is intended as a visual decision-support tool and should be used together with price action, trend analysis, support and resistance, and proper risk management.
Disclaimer
This script is for educational and informational purposes only.
It is not financial advice. Always test any trading approach carefully before using it in live markets.
1m, 5m, 15m, 30m, 45m, 1h, 2h, 6h, 1D
Instead of switching between charts, the script displays all selected timeframes side by side in a clean column layout. Each column represents one timeframe and shows the current position of the two Stoch RSI lines, making it easier to quickly understand momentum conditions across multiple market structures.
Main Features
Multi-timeframe Stoch RSI visualization
9 fixed timeframe columns
K and D lines shown inside each column
Gradient background based on oscillator level
Quick visual identification of overbought and oversold areas
20 / 50 / 80 reference levels
Optional numeric K and D values
Compact layout designed for fast market reading
How to Read It
Each column represents a timeframe.
The vertical position of the lines shows where the Stoch RSI currently is:
Near the bottom: oversold / weak momentum area
Around the middle: neutral zone
Near the top: overbought / strong momentum area
The background gradient helps identify the oscillator zone immediately, while the two plotted lines allow you to see the current relationship between K and D.
This is useful when you want to compare short-term and higher-timeframe momentum at a glance.
Typical Use Cases
Scalping confirmation
Multi-timeframe momentum alignment
Spotting overbought / oversold conditions across timeframes
Filtering entries based on higher-timeframe context
Quickly checking whether short-term movement agrees with broader market structure
Notes
This indicator does not generate buy or sell signals by itself.
It is intended as a visual decision-support tool and should be used together with price action, trend analysis, support and resistance, and proper risk management.
Disclaimer
This script is for educational and informational purposes only.
It is not financial advice. Always test any trading approach carefully before using it in live markets.
リリースノート
updateオープンソーススクリプト
TradingViewの精神に則り、このスクリプトの作者はコードをオープンソースとして公開してくれました。トレーダーが内容を確認・検証できるようにという配慮です。作者に拍手を送りましょう!無料で利用できますが、コードの再公開はハウスルールに従う必要があります。

免責事項
これらの情報および投稿は、TradingViewが提供または承認する金融、投資、取引、またはその他の種類の助言もしくは推奨であることを意図したものではなく、またこれらに該当するものでもありません。詳細は利用規約をご覧ください。
オープンソーススクリプト
TradingViewの精神に則り、このスクリプトの作者はコードをオープンソースとして公開してくれました。トレーダーが内容を確認・検証できるようにという配慮です。作者に拍手を送りましょう!無料で利用できますが、コードの再公開はハウスルールに従う必要があります。
免責事項
これらの情報および投稿は、TradingViewが提供または承認する金融、投資、取引、またはその他の種類の助言もしくは推奨であることを意図したものではなく、またこれらに該当するものでもありません。詳細は利用規約をご覧ください。