OPEN-SOURCE SCRIPT
Sati Dashboard 9-Box (Position Fixed)
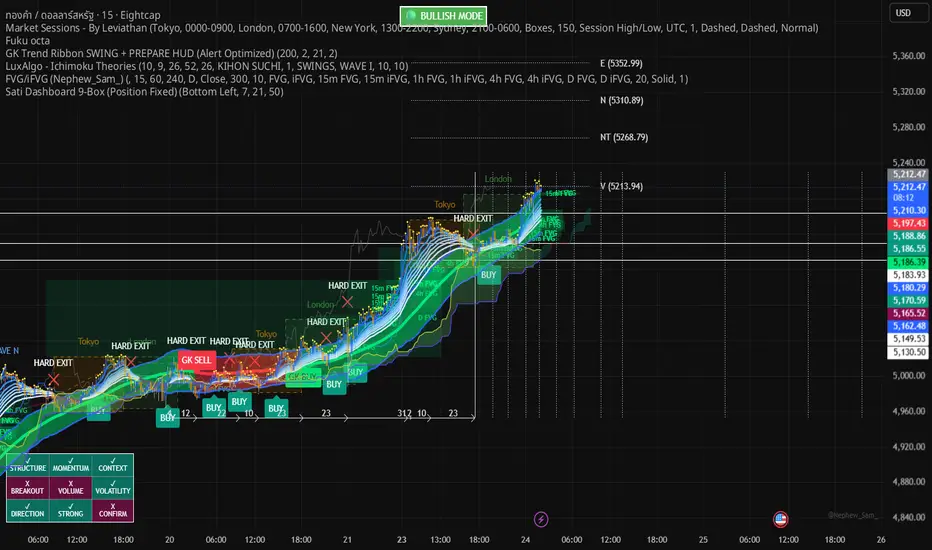
ATI Dashboard 9-Box (Position Fixed) is a trade management system built as a “Stable Architecture of Mindfulness”—turning market complexity into a simple checklist to reduce emotional decisions and strengthen discipline.
Core Philosophy
“Not to be the most accurate entry machine, but to keep you from losing your mind.”
This system isn’t designed to make you chase price arrows. It’s designed to verify market readiness across four key dimensions—Structure, Momentum, Context, and Volume—before you commit capital.
Key Features
9-Box Checklist Dashboard: A 9-cell binary (Yes/No) checklist that filters out market noise.
Structure: Validates price structure using EMA 21 and EMA 50.
Momentum: Confirms driving force via RSI and price swing/impulse strength.
Context: Confirms the higher-timeframe trend using 1H, so you don’t trade against the main trend.
Volume & Volatility: Confirms sufficient trading volume and appropriate volatility.
Signal Stability: An intelligent signal filter that reduces whipsaw in sideways markets by locking the BUY signal until a clear exit condition appears.
Hard Exit Protection: Triggers an immediate exit alert when structure breaks (e.g., a candle closes beyond the Base Line) to protect capital before major damage occurs.
Customizable UI (Position Fixed): You can move the Dashboard to different screen corners via Settings (Top Right, Bottom Left, etc.) to fit both desktop and mobile screens.
How to Use
Wait for the Checklist: Watch the 9-box Dashboard. If more than 6–7 boxes turn green (✓), the market is considered highly ready.
Entry: Enter when the “BUY” label appears while the readiness score meets the threshold.
Exit: Consider closing when “HARD EXIT” (red X) appears, or when multiple boxes start turning red (X), indicating weakening structure.
Settings
Dashboard Position: Choose the corner where the panel will appear.
Minimum Score: Adjust how “strict” the signal is (recommended: 7 for higher accuracy).
Base Line: Adjust the EMA value to match your preferred timeframe.
Risk Disclaimer: Trading involves risk. This indicator is only a decision-support tool based on statistics and mathematics. Users must apply their own risk management at all times.
Core Philosophy
“Not to be the most accurate entry machine, but to keep you from losing your mind.”
This system isn’t designed to make you chase price arrows. It’s designed to verify market readiness across four key dimensions—Structure, Momentum, Context, and Volume—before you commit capital.
Key Features
9-Box Checklist Dashboard: A 9-cell binary (Yes/No) checklist that filters out market noise.
Structure: Validates price structure using EMA 21 and EMA 50.
Momentum: Confirms driving force via RSI and price swing/impulse strength.
Context: Confirms the higher-timeframe trend using 1H, so you don’t trade against the main trend.
Volume & Volatility: Confirms sufficient trading volume and appropriate volatility.
Signal Stability: An intelligent signal filter that reduces whipsaw in sideways markets by locking the BUY signal until a clear exit condition appears.
Hard Exit Protection: Triggers an immediate exit alert when structure breaks (e.g., a candle closes beyond the Base Line) to protect capital before major damage occurs.
Customizable UI (Position Fixed): You can move the Dashboard to different screen corners via Settings (Top Right, Bottom Left, etc.) to fit both desktop and mobile screens.
How to Use
Wait for the Checklist: Watch the 9-box Dashboard. If more than 6–7 boxes turn green (✓), the market is considered highly ready.
Entry: Enter when the “BUY” label appears while the readiness score meets the threshold.
Exit: Consider closing when “HARD EXIT” (red X) appears, or when multiple boxes start turning red (X), indicating weakening structure.
Settings
Dashboard Position: Choose the corner where the panel will appear.
Minimum Score: Adjust how “strict” the signal is (recommended: 7 for higher accuracy).
Base Line: Adjust the EMA value to match your preferred timeframe.
Risk Disclaimer: Trading involves risk. This indicator is only a decision-support tool based on statistics and mathematics. Users must apply their own risk management at all times.
オープンソーススクリプト
TradingViewの精神に則り、このスクリプトの作者はコードをオープンソースとして公開してくれました。トレーダーが内容を確認・検証できるようにという配慮です。作者に拍手を送りましょう!無料で利用できますが、コードの再公開はハウスルールに従う必要があります。

免責事項
これらの情報および投稿は、TradingViewが提供または承認する金融、投資、取引、またはその他の種類の助言もしくは推奨であることを意図したものではなく、またこれらに該当するものでもありません。詳細は利用規約をご覧ください。
オープンソーススクリプト
TradingViewの精神に則り、このスクリプトの作者はコードをオープンソースとして公開してくれました。トレーダーが内容を確認・検証できるようにという配慮です。作者に拍手を送りましょう!無料で利用できますが、コードの再公開はハウスルールに従う必要があります。
免責事項
これらの情報および投稿は、TradingViewが提供または承認する金融、投資、取引、またはその他の種類の助言もしくは推奨であることを意図したものではなく、またこれらに該当するものでもありません。詳細は利用規約をご覧ください。