BTC Average Daily Returns by Day
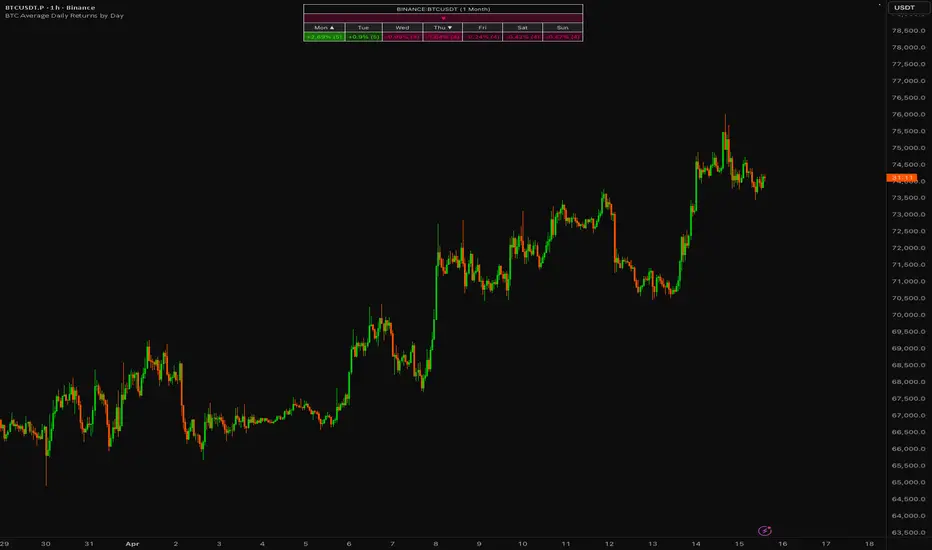
Average Daily Returns by Day
A clean weekday performance dashboard that shows the average daily return for each day of the week using a selectable lookback period.
The script uses daily data internally, so it stays consistent across chart timeframes while letting you view the stats directly on your chart as either a table or a centered top bar.
Features
How to use
Use it to quickly see whether a market has recently shown stronger or weaker performance on specific weekdays. It works best as a context tool alongside price action, structure, volatility, and broader market conditions.
Important
This indicator is descriptive, not predictive. Weekday tendencies can shift, especially on shorter lookbacks, so it should not be used as a standalone signal.

A clean weekday performance dashboard that shows the average daily return for each day of the week using a selectable lookback period.
The script uses daily data internally, so it stays consistent across chart timeframes while letting you view the stats directly on your chart as either a table or a centered top bar.
Features
- Weekday average returns
- 1W, 2W, 1M, 3M, 6M, 1Y lookbacks
- Table or top bar display
- Current-day bias signal built into the UI
- Optional heatmap, best/worst day highlight, and sample count
- Custom colors and preset themes
How to use
Use it to quickly see whether a market has recently shown stronger or weaker performance on specific weekdays. It works best as a context tool alongside price action, structure, volatility, and broader market conditions.
Important
This indicator is descriptive, not predictive. Weekday tendencies can shift, especially on shorter lookbacks, so it should not be used as a standalone signal.

免責事項
これらの情報および投稿は、TradingViewが提供または承認する金融、投資、取引、またはその他の種類の助言もしくは推奨であることを意図したものではなく、またこれらに該当するものでもありません。詳細は利用規約をご覧ください。
免責事項
これらの情報および投稿は、TradingViewが提供または承認する金融、投資、取引、またはその他の種類の助言もしくは推奨であることを意図したものではなく、またこれらに該当するものでもありません。詳細は利用規約をご覧ください。