OPEN-SOURCE SCRIPT
更新済 Historical Date Average Prediction
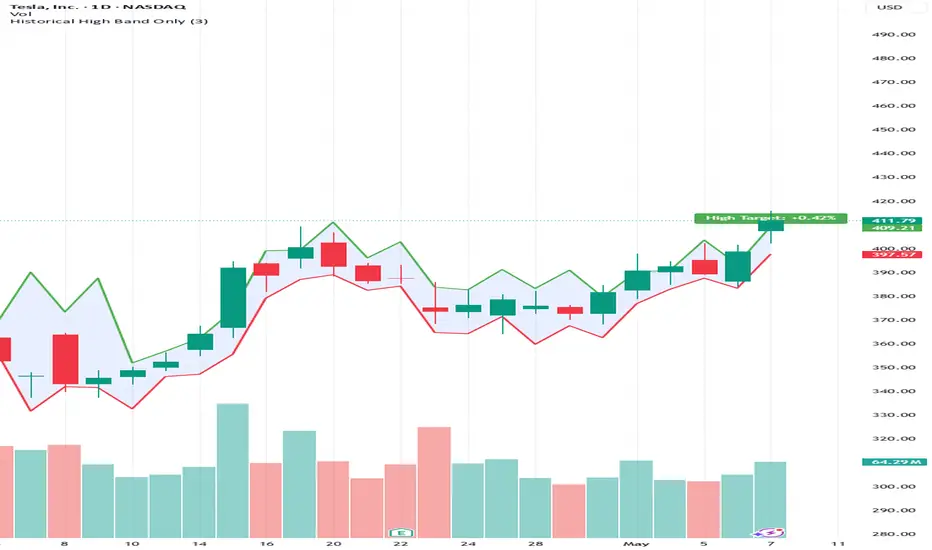
How it Works
Date Matching: The script attempts to find the bar where the month and dayofmonth match today’s date.
Offset Calculation: Since there are roughly 252 trading days in a year, the script looks back in increments of 252 (or uses timestamp functions) to find the price action from 1, 2, or 5 years ago today.
The Average: It sums the highs and lows of those specific historical days and divides them by the number of years found.
Date Matching: The script attempts to find the bar where the month and dayofmonth match today’s date.
Offset Calculation: Since there are roughly 252 trading days in a year, the script looks back in increments of 252 (or uses timestamp functions) to find the price action from 1, 2, or 5 years ago today.
The Average: It sums the highs and lows of those specific historical days and divides them by the number of years found.
リリースノート
I have also added a "Future Extension" logic to the labels. Since you noticed the labels "go off chart" or get messy when moving the price axis, this version anchors the label to the very last bar and ensures it only calculates for the high side.オープンソーススクリプト
TradingViewの精神に則り、このスクリプトの作者はコードをオープンソースとして公開してくれました。トレーダーが内容を確認・検証できるようにという配慮です。作者に拍手を送りましょう!無料で利用できますが、コードの再公開はハウスルールに従う必要があります。

免責事項
これらの情報および投稿は、TradingViewが提供または承認する金融、投資、取引、またはその他の種類の助言もしくは推奨であることを意図したものではなく、またこれらに該当するものでもありません。詳細は利用規約をご覧ください。
オープンソーススクリプト
TradingViewの精神に則り、このスクリプトの作者はコードをオープンソースとして公開してくれました。トレーダーが内容を確認・検証できるようにという配慮です。作者に拍手を送りましょう!無料で利用できますが、コードの再公開はハウスルールに従う必要があります。
免責事項
これらの情報および投稿は、TradingViewが提供または承認する金融、投資、取引、またはその他の種類の助言もしくは推奨であることを意図したものではなく、またこれらに該当するものでもありません。詳細は利用規約をご覧ください。