アップデート済
Coil & Break
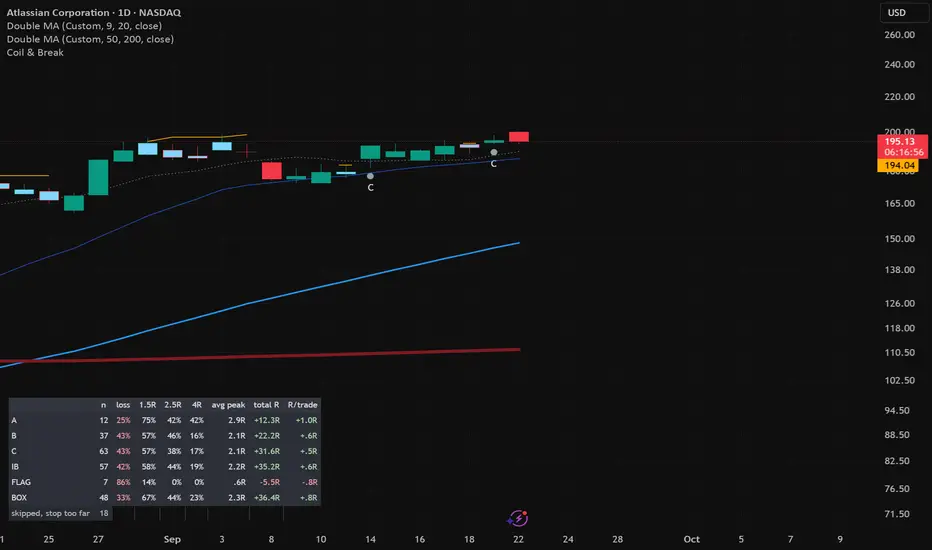
Coil & Break: Inside Bar, Bull Flag & Range
## What it does
Three bullish patterns share one idea: price pauses, coils, and then expands.
This script finds all three, marks them **while they are still forming**, and
grades the breakout when it happens.
It is a setup finder, not a trading system. It does not place stops, project
targets, or tell you when to exit. Those decisions depend on an environment the
chart cannot see.
Long only, by design.
## The three patterns
**Inside bar** — a bar whose whole range sits inside the previous bar's range.
Three definitions are selectable: the classic range-in-range, body-in-body (a
harami), and range-in-body, which is the tightest and rarest of the three.
**Bull flag** — an impulsive rise, then a shallow pause. The pole must clear a
minimum size in ATR or percent; the flag must not retrace more than a set share
of it, must resolve inside a bar window, and, optionally, must show volume
drying up while it rests. That last one is the honest tell of a flag: not a
wave of sellers, just an absence of buying.
**Tight range** — a quiet box with no flagpole behind it. Measured as the height
of a rolling window against ATR or a percentage. This is the pattern the flag
logic structurally cannot see, because a flag refuses to exist without a
preceding impulse.
## Grading: the part that matters
Every breakout is graded by how many **independent** factors back it:
- **Trend** — where price sits in the bigger picture
- **Momentum** — MACD above zero
- **Volume** — participation above its average
- **Pressure** — the breakout bar closing in the upper part of its own range
Each vote comes from a different kind of evidence. That is deliberate. Two
moving-average crossovers agreeing is not two confirmations — it is one
measurement read twice. That is why there is no MA-cross signal in this script,
only the grade it feeds.
- **A** — every available vote agreed
- **B** — all but one
- **C** — weaker (hidden by default)
The grade is relative to what is *knowable*. A vote you switch off drops out of
the maximum. So does one that cannot be measured yet: on an unfinished daily
bar, volume is a fraction of a session being compared against whole sessions, so
the volume vote leaves the calculation entirely and rejoins at the close. A
setup is never marked down for a reason you could not have known at the time.
## Reading the chart
- **Light blue bars** — a setup is armed here, waiting
- **Amber line** — the price it has to clear. It sits still; it does not crawl
- **A / B / C icon** — the setup triggered, graded
That is the whole visual vocabulary. Three things.
## Repainting
With **Trigger on closed bars only** enabled — the default — signals are fixed
once a bar closes and history is honest.
Turn it off and icons appear the moment price clears the level, and can vanish
if price falls back before the close. That is not a bug; it is the correct
setting if you execute intraday and need to see the break as it happens rather
than hours later. Know which mode you are in.
## Settings worth knowing
- **Trend MA** (default 200) gates everything. A setup against the trend is
never actionable in a long-only method, so it is filtered rather than graded.
- **Volume while the bar is still open** decides how partial volume is treated.
- **Show which grades** hides C by default. Set it to Everything while you are
studying what the script rejects.
- Every pattern can be disabled independently.
## Honest limitations
Patterns are recognised by numbers; your eye recognises them by shape. The two
overlap, but not perfectly. The script will flag consolidations that do not look
like textbook examples, and it will miss ones you can see clearly, usually
because a threshold was missed by a hair. The parameters exist so you can pull
the numbers closer to your own eye — expect to spend time on that rather than
trusting the defaults.
Grading measures agreement among indicators. Agreement is not edge. Nothing here
has been backtested for you.
## What it does
Three bullish patterns share one idea: price pauses, coils, and then expands.
This script finds all three, marks them **while they are still forming**, and
grades the breakout when it happens.
It is a setup finder, not a trading system. It does not place stops, project
targets, or tell you when to exit. Those decisions depend on an environment the
chart cannot see.
Long only, by design.
## The three patterns
**Inside bar** — a bar whose whole range sits inside the previous bar's range.
Three definitions are selectable: the classic range-in-range, body-in-body (a
harami), and range-in-body, which is the tightest and rarest of the three.
**Bull flag** — an impulsive rise, then a shallow pause. The pole must clear a
minimum size in ATR or percent; the flag must not retrace more than a set share
of it, must resolve inside a bar window, and, optionally, must show volume
drying up while it rests. That last one is the honest tell of a flag: not a
wave of sellers, just an absence of buying.
**Tight range** — a quiet box with no flagpole behind it. Measured as the height
of a rolling window against ATR or a percentage. This is the pattern the flag
logic structurally cannot see, because a flag refuses to exist without a
preceding impulse.
## Grading: the part that matters
Every breakout is graded by how many **independent** factors back it:
- **Trend** — where price sits in the bigger picture
- **Momentum** — MACD above zero
- **Volume** — participation above its average
- **Pressure** — the breakout bar closing in the upper part of its own range
Each vote comes from a different kind of evidence. That is deliberate. Two
moving-average crossovers agreeing is not two confirmations — it is one
measurement read twice. That is why there is no MA-cross signal in this script,
only the grade it feeds.
- **A** — every available vote agreed
- **B** — all but one
- **C** — weaker (hidden by default)
The grade is relative to what is *knowable*. A vote you switch off drops out of
the maximum. So does one that cannot be measured yet: on an unfinished daily
bar, volume is a fraction of a session being compared against whole sessions, so
the volume vote leaves the calculation entirely and rejoins at the close. A
setup is never marked down for a reason you could not have known at the time.
## Reading the chart
- **Light blue bars** — a setup is armed here, waiting
- **Amber line** — the price it has to clear. It sits still; it does not crawl
- **A / B / C icon** — the setup triggered, graded
That is the whole visual vocabulary. Three things.
## Repainting
With **Trigger on closed bars only** enabled — the default — signals are fixed
once a bar closes and history is honest.
Turn it off and icons appear the moment price clears the level, and can vanish
if price falls back before the close. That is not a bug; it is the correct
setting if you execute intraday and need to see the break as it happens rather
than hours later. Know which mode you are in.
## Settings worth knowing
- **Trend MA** (default 200) gates everything. A setup against the trend is
never actionable in a long-only method, so it is filtered rather than graded.
- **Volume while the bar is still open** decides how partial volume is treated.
- **Show which grades** hides C by default. Set it to Everything while you are
studying what the script rejects.
- Every pattern can be disabled independently.
## Honest limitations
Patterns are recognised by numbers; your eye recognises them by shape. The two
overlap, but not perfectly. The script will flag consolidations that do not look
like textbook examples, and it will miss ones you can see clearly, usually
because a threshold was missed by a hair. The parameters exist so you can pull
the numbers closer to your own eye — expect to spend time on that rather than
trusting the defaults.
Grading measures agreement among indicators. Agreement is not edge. Nothing here
has been backtested for you.
リリースノート
Added table to see possible results and made bull flag more conservative.リリースノート
I have updated some default settings, and the way the table is calculating the PnL. Now by default the user will see A B and C tear setups and will see them while the candle is still not finished. Volume vote is disabled by default but if you are someone that makes your trades at the end of the day it would be good if turn it on. 
免責事項
これらの情報および投稿は、TradingViewが提供または承認する金融、投資、取引、またはその他の種類の助言もしくは推奨であることを意図したものではなく、またこれらに該当するものでもありません。詳細は利用規約をご覧ください。
免責事項
これらの情報および投稿は、TradingViewが提供または承認する金融、投資、取引、またはその他の種類の助言もしくは推奨であることを意図したものではなく、またこれらに該当するものでもありません。詳細は利用規約をご覧ください。