Time
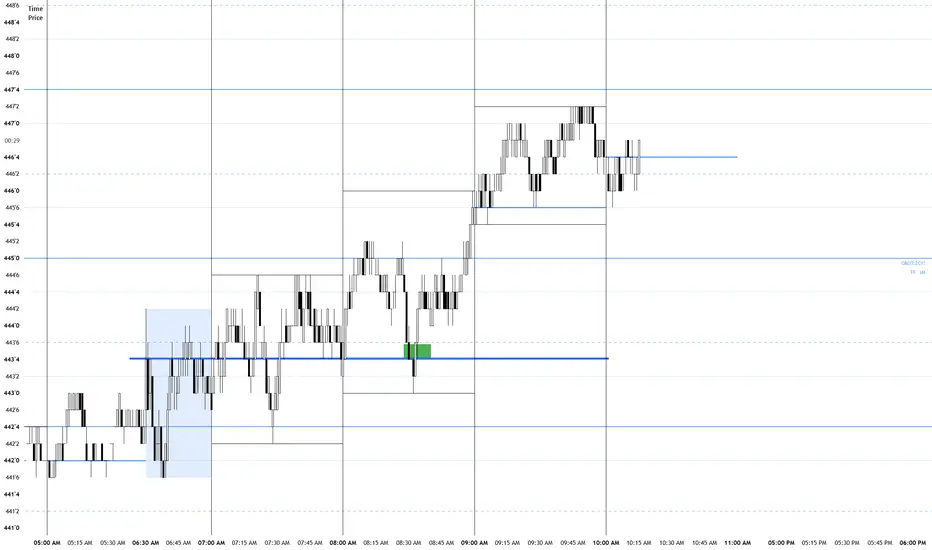
Time is the main structural indicator. It shows how price is organized across different periods without mixing in the Quarter Theory number levels.
Opening boxes
The indicator can display the first 30 minutes of:
- Tokyo
- London
- New York
Each session has an editable local-time schedule, color, border style, and historical display count. Session calculations account for the named local timezone and daylight-saving changes.
The opening-box VWAP has been removed.
EMAs
There are two independent EMA systems. Each EMA has its own:
- Calculation timeframe
- Source
- Length
- Color
- Width
- Line style
- Weekly visibility
- 8-hour visibility
- 15-minute visibility
- Entry-timeframe visibility
EMA 1 defaults to a 96-period EMA calculated from the 5-minute chart. EMA 2 defaults to a 96-period EMA calculated from the 1-minute chart.
When a higher-timeframe EMA is displayed on a lower chart, Time connects the confirmed EMA samples to produce a smoother visual without changing the underlying EMA calculation.
Weekly-chart structure
On the weekly chart, Time can display:
- Completed yearly high/low ranges
- Yearly separators
- Prior yearly closes
- Completed quarterly high/low ranges
- Quarterly separators
The historical counts and visual styles are editable. Prior yearly closes can display up to 12 periods, with the default set to 10.
8-hour structure
On the 8-hour chart, Time can display:
- Completed monthly high/low ranges
- Monthly separators
- Prior monthly closes
- Completed weekly high/low ranges
- Weekly separators
The weekly range history defaults to the most recent two completed weeks, while monthly history can be extended further.
Monthly high/low ranges are also available on the daily chart, giving the daily chart a higher-timeframe structure similar to how daily ranges appear on intraday charts.
15-minute structure
The 15-minute section provides:
- Completed daily high/low ranges
- Daily separators
- Prior daily closes
- Custom 8-hour high/low ranges
- 8-hour separators
- Weekday labels
Daily ranges can also operate on supported intraday charts between 15 minutes and 4 hours. Prior daily closes are restricted to the exact 15-minute chart.
The 8-hour structure is based on the intended custom 8-hour trading blocks rather than arbitrary chart-bar groupings.
Entry-timeframe structure
Entry timeframes are charts below 15 minutes. This section provides:
- Completed 1-hour high/low ranges
- 1-hour opening and closing separators
- Prior 1-hour closes
- Completed 15-minute high/low ranges on the 1-minute chart
- 15-minute separators
- Prior 15-minute closes on the 1-minute chart
The hourly ranges use complete clock-hour periods, such as 6:00–7:00 and 7:00–8:00. They are not intentionally divided into 30-minute ranges.
Separators and holidays
Separators can either:
- Extend through the chart, or
- Remain confined to their associated high/low range
Time uses actual exchange trading periods. Closed holidays do not create artificial trading days. Abnormally long holiday periods are divided so that a single range or separator does not stretch across several calendar days. Continuous markets such as cryptocurrency can retain their Saturday and Sunday structure.
Opening boxes
The indicator can display the first 30 minutes of:
- Tokyo
- London
- New York
Each session has an editable local-time schedule, color, border style, and historical display count. Session calculations account for the named local timezone and daylight-saving changes.
The opening-box VWAP has been removed.
EMAs
There are two independent EMA systems. Each EMA has its own:
- Calculation timeframe
- Source
- Length
- Color
- Width
- Line style
- Weekly visibility
- 8-hour visibility
- 15-minute visibility
- Entry-timeframe visibility
EMA 1 defaults to a 96-period EMA calculated from the 5-minute chart. EMA 2 defaults to a 96-period EMA calculated from the 1-minute chart.
When a higher-timeframe EMA is displayed on a lower chart, Time connects the confirmed EMA samples to produce a smoother visual without changing the underlying EMA calculation.
Weekly-chart structure
On the weekly chart, Time can display:
- Completed yearly high/low ranges
- Yearly separators
- Prior yearly closes
- Completed quarterly high/low ranges
- Quarterly separators
The historical counts and visual styles are editable. Prior yearly closes can display up to 12 periods, with the default set to 10.
8-hour structure
On the 8-hour chart, Time can display:
- Completed monthly high/low ranges
- Monthly separators
- Prior monthly closes
- Completed weekly high/low ranges
- Weekly separators
The weekly range history defaults to the most recent two completed weeks, while monthly history can be extended further.
Monthly high/low ranges are also available on the daily chart, giving the daily chart a higher-timeframe structure similar to how daily ranges appear on intraday charts.
15-minute structure
The 15-minute section provides:
- Completed daily high/low ranges
- Daily separators
- Prior daily closes
- Custom 8-hour high/low ranges
- 8-hour separators
- Weekday labels
Daily ranges can also operate on supported intraday charts between 15 minutes and 4 hours. Prior daily closes are restricted to the exact 15-minute chart.
The 8-hour structure is based on the intended custom 8-hour trading blocks rather than arbitrary chart-bar groupings.
Entry-timeframe structure
Entry timeframes are charts below 15 minutes. This section provides:
- Completed 1-hour high/low ranges
- 1-hour opening and closing separators
- Prior 1-hour closes
- Completed 15-minute high/low ranges on the 1-minute chart
- 15-minute separators
- Prior 15-minute closes on the 1-minute chart
The hourly ranges use complete clock-hour periods, such as 6:00–7:00 and 7:00–8:00. They are not intentionally divided into 30-minute ranges.
Separators and holidays
Separators can either:
- Extend through the chart, or
- Remain confined to their associated high/low range
Time uses actual exchange trading periods. Closed holidays do not create artificial trading days. Abnormally long holiday periods are divided so that a single range or separator does not stretch across several calendar days. Continuous markets such as cryptocurrency can retain their Saturday and Sunday structure.

免責事項
これらの情報および投稿は、TradingViewが提供または承認する金融、投資、取引、またはその他の種類の助言もしくは推奨であることを意図したものではなく、またこれらに該当するものでもありません。詳細は利用規約をご覧ください。
免責事項
これらの情報および投稿は、TradingViewが提供または承認する金融、投資、取引、またはその他の種類の助言もしくは推奨であることを意図したものではなく、またこれらに該当するものでもありません。詳細は利用規約をご覧ください。