OPEN-SOURCE SCRIPT
Momentum Indikator (Avg Volume)
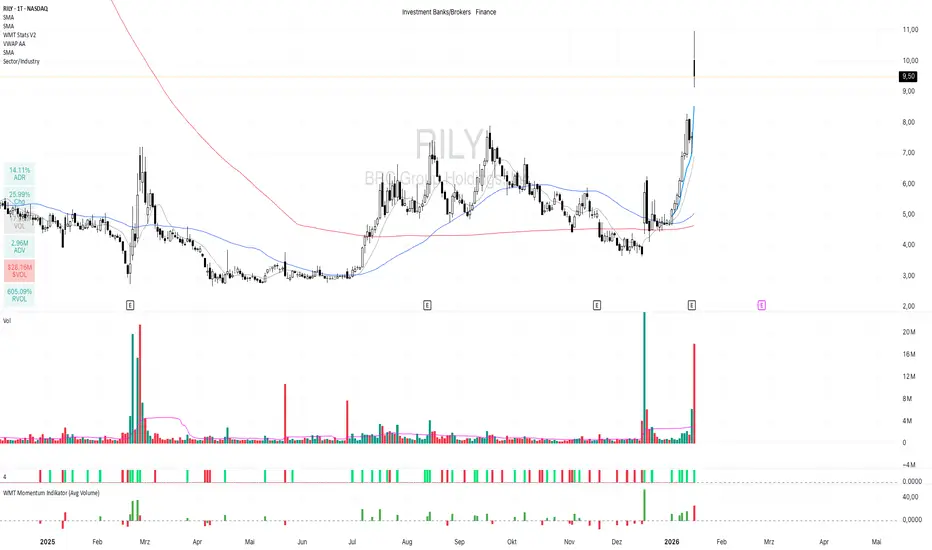
Momentum Indicator (Avg Volume)
1. Purpose of the Indicator
The WMT Momentum Indicator (Avg Volume) is designed to highlight strong price movements accompanied by increased trading volume.
It specifically filters for trading days where:
volume is increasing,
volume is above its average,
and the percentage price movement exceeds a defined threshold.
The goal is to identify momentum days early — both bullish and bearish.
2. Display & Visualization
Visualization: Histogram (columns)
Panel: Separate indicator window (overlay = false)
Y-Axis: Percentage price change compared to the previous close
Colors:
🟢 Green: Positive daily movement (Close ≥ Open)
🔴 Red: Negative daily movement (Close < Open)
Zero Line: Reference line separating positive and negative momentum
3. Input Parameters
Parameter Description Default
+/- Movement Threshold (%) Minimum absolute daily price movement in percent 4.0 %
Volume Average (Days) Period for the moving average of volume 20 days
4. Logic & Calculations
4.1 Volume Conditions
The indicator only considers days where:
Volume is higher than the previous day
volHigherPrev = volume > volume[1]
Volume is above the moving average
avgVolume = ta.sma(volume, volLength)
volAboveAvg = volume > avgVolume
➡️ This ensures that only days with unusually high market participation are taken into account.
4.2 Price Movement
Percentage change vs. previous close
priceMovePct = (close - close[1]) / close[1] * 100
Absolute movement
absMovePct = math.abs(priceMovePct)
Intraday direction
priceMoveDay = close - open
4.3 Direction Logic
Condition Meaning
priceMoveDay ≥ 0 Bullish day (green)
priceMoveDay < 0 Bearish day (red)
4.4 Main Condition (Signal Filter)
A bar is displayed only if all of the following conditions are met:
showBar =
volHigherPrev and
volAboveAvg and
absMovePct >= moveThreshold
➡️ Interpretation:
Only strong price movements with rising and above-average volume are visualized.
5. Color Logic
barColor =
showBar and volGreen ? color.green :
showBar and volRed ? color.red :
na
Color Meaning
Green Strong bullish momentum
Red Strong bearish momentum
No bar Conditions not met
6. Plot Description
Momentum Histogram
plot(
showBar ? priceMovePct : na,
style = plot.style_columns
)
Bars are plotted only when showBar = true
Bar height represents the percentage change vs. previous close
Direction and color indicate momentum direction
Zero Line
hline(0, "0-Line")
Visual separation between positive and negative momentum
Helps with quick interpretation
7. Typical Use Cases
Identifying breakout days
Confirming trend continuation
Detecting distribution or accumulation
Filtering for momentum trading & swing trading
Complementing price action or volume-based strategies
8. Practical Interpretation
Tall green bar:
→ Strong buying pressure, potential trend start or continuation
Tall red bar:
→ Strong selling pressure, possible trend exhaustion or short signal
No bars:
→ Market without relevant momentum (sideways / low volume)
1. Purpose of the Indicator
The WMT Momentum Indicator (Avg Volume) is designed to highlight strong price movements accompanied by increased trading volume.
It specifically filters for trading days where:
volume is increasing,
volume is above its average,
and the percentage price movement exceeds a defined threshold.
The goal is to identify momentum days early — both bullish and bearish.
2. Display & Visualization
Visualization: Histogram (columns)
Panel: Separate indicator window (overlay = false)
Y-Axis: Percentage price change compared to the previous close
Colors:
🟢 Green: Positive daily movement (Close ≥ Open)
🔴 Red: Negative daily movement (Close < Open)
Zero Line: Reference line separating positive and negative momentum
3. Input Parameters
Parameter Description Default
+/- Movement Threshold (%) Minimum absolute daily price movement in percent 4.0 %
Volume Average (Days) Period for the moving average of volume 20 days
4. Logic & Calculations
4.1 Volume Conditions
The indicator only considers days where:
Volume is higher than the previous day
volHigherPrev = volume > volume[1]
Volume is above the moving average
avgVolume = ta.sma(volume, volLength)
volAboveAvg = volume > avgVolume
➡️ This ensures that only days with unusually high market participation are taken into account.
4.2 Price Movement
Percentage change vs. previous close
priceMovePct = (close - close[1]) / close[1] * 100
Absolute movement
absMovePct = math.abs(priceMovePct)
Intraday direction
priceMoveDay = close - open
4.3 Direction Logic
Condition Meaning
priceMoveDay ≥ 0 Bullish day (green)
priceMoveDay < 0 Bearish day (red)
4.4 Main Condition (Signal Filter)
A bar is displayed only if all of the following conditions are met:
showBar =
volHigherPrev and
volAboveAvg and
absMovePct >= moveThreshold
➡️ Interpretation:
Only strong price movements with rising and above-average volume are visualized.
5. Color Logic
barColor =
showBar and volGreen ? color.green :
showBar and volRed ? color.red :
na
Color Meaning
Green Strong bullish momentum
Red Strong bearish momentum
No bar Conditions not met
6. Plot Description
Momentum Histogram
plot(
showBar ? priceMovePct : na,
style = plot.style_columns
)
Bars are plotted only when showBar = true
Bar height represents the percentage change vs. previous close
Direction and color indicate momentum direction
Zero Line
hline(0, "0-Line")
Visual separation between positive and negative momentum
Helps with quick interpretation
7. Typical Use Cases
Identifying breakout days
Confirming trend continuation
Detecting distribution or accumulation
Filtering for momentum trading & swing trading
Complementing price action or volume-based strategies
8. Practical Interpretation
Tall green bar:
→ Strong buying pressure, potential trend start or continuation
Tall red bar:
→ Strong selling pressure, possible trend exhaustion or short signal
No bars:
→ Market without relevant momentum (sideways / low volume)
オープンソーススクリプト
TradingViewの精神に則り、このスクリプトの作者はコードをオープンソースとして公開してくれました。トレーダーが内容を確認・検証できるようにという配慮です。作者に拍手を送りましょう!無料で利用できますが、コードの再公開はハウスルールに従う必要があります。

免責事項
これらの情報および投稿は、TradingViewが提供または承認する金融、投資、取引、またはその他の種類の助言もしくは推奨であることを意図したものではなく、またこれらに該当するものでもありません。詳細は利用規約をご覧ください。
オープンソーススクリプト
TradingViewの精神に則り、このスクリプトの作者はコードをオープンソースとして公開してくれました。トレーダーが内容を確認・検証できるようにという配慮です。作者に拍手を送りましょう!無料で利用できますが、コードの再公開はハウスルールに従う必要があります。
免責事項
これらの情報および投稿は、TradingViewが提供または承認する金融、投資、取引、またはその他の種類の助言もしくは推奨であることを意図したものではなく、またこれらに該当するものでもありません。詳細は利用規約をご覧ください。