OPEN-SOURCE SCRIPT
アップデート済 Electronic Trading Hours Session/Candles
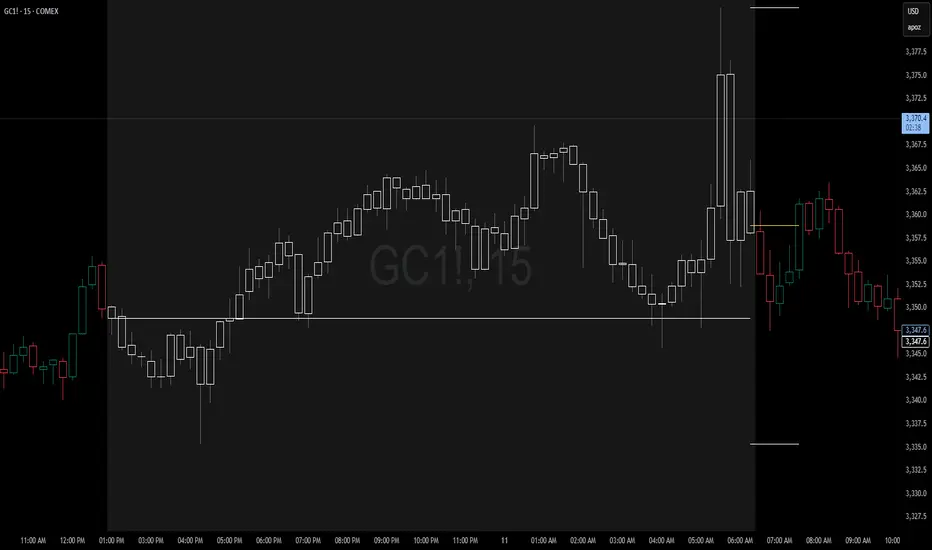
This indicator visually distinguishes the electronic trading session, spanning from the prior day's close (e.g., 5:00 PM EST) through the overnight period until the next day's opening bell (e.g., 9:30 AM EST).
It can be customized to highlight this period with a shaded zone or colored candles depending on the trader’s preference.
The overnight levels that create the opening range gap often act as critical zones of liquidity.
The indicator provides a clear visual cue of potential price magnets that smart money (institutional traders) may target during the opening bell session to trigger liquidity sweeps.
It can be customized to highlight this period with a shaded zone or colored candles depending on the trader’s preference.
The overnight levels that create the opening range gap often act as critical zones of liquidity.
The indicator provides a clear visual cue of potential price magnets that smart money (institutional traders) may target during the opening bell session to trigger liquidity sweeps.
リリースノート
Changed timezone string to use IANA database b/c calculations dynamically adapt to a region's time changes, including DST and time zone updates, instead of using a static UTC offset.リリースノート
The script now visualizes the high, low, and equilibrium of the price range during Electronic Trading Hours (ETH) and displays the previous day's Regular Trading Hours (RTH) closing price as a benchmark for calculating the RTH gap.These tools empower traders to evaluate market positioning relative to critical intraday levels.
オープンソーススクリプト
TradingViewの精神に則り、このスクリプトの作者はコードをオープンソースとして公開してくれました。トレーダーが内容を確認・検証できるようにという配慮です。作者に拍手を送りましょう!無料で利用できますが、コードの再公開はハウスルールに従う必要があります。

免責事項
これらの情報および投稿は、TradingViewが提供または承認する金融、投資、取引、またはその他の種類の助言もしくは推奨であることを意図したものではなく、またこれらに該当するものでもありません。詳細は利用規約をご覧ください。
オープンソーススクリプト
TradingViewの精神に則り、このスクリプトの作者はコードをオープンソースとして公開してくれました。トレーダーが内容を確認・検証できるようにという配慮です。作者に拍手を送りましょう!無料で利用できますが、コードの再公開はハウスルールに従う必要があります。
免責事項
これらの情報および投稿は、TradingViewが提供または承認する金融、投資、取引、またはその他の種類の助言もしくは推奨であることを意図したものではなく、またこれらに該当するものでもありません。詳細は利用規約をご覧ください。