OPEN-SOURCE SCRIPT
Kurdistani BITCOIN POWER LAW
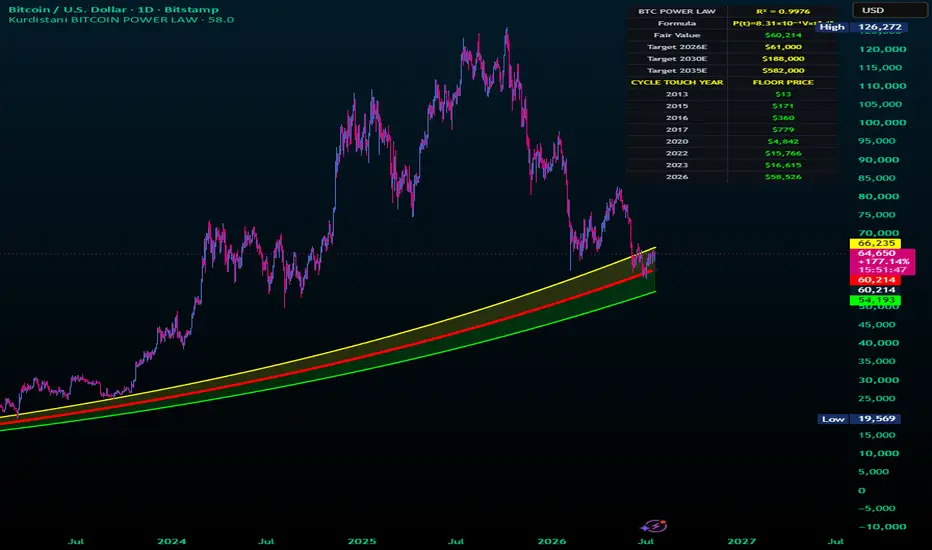
Kurdistani Bitcoin Power Law
The Kurdistani Bitcoin Power Law is a long-term macro analysis tool for Bitcoin ( BTC$), built entirely in **Pine Script v6**. It models Bitcoin's historical growth trajectory over time using a log-log power-law relationship, treating time not as a linear metric, but as an exponential driver of value.
This script maps out Bitcoin's structural "Fair Value" alongside its cyclical boundaries, providing long-term investors with clear macroeconomic floors, ceilings, accumulation zones, and historical touch-points.
---
🔬 The Math Behind the Model
Unlike standard exponential models that eventually experience unrealistic vertical explosions, a power law models a diminishing growth rate over time.
The indicator calculates elapsed days since Bitcoin's Genesis Block (January 3, 2009) and uses the following regression formula to establish the center fair value band:
$$P(t) = 8.31 \times 10^{-17} \times t^{5.48}$$
Where $t$ represents the total number of days elapsed since the genesis block. This model boasts an incredibly high historical correlation coefficient ($R^2 = 0.9976$).
---
🎨 Visual Breakdown & Color Map
The chart overlays a structured channel designed for high visual clarity, utilizing a custom dark theme interface:
Center Line (Pure Red):The fundamental **Fair Value** anchor of the Power Law model.
Upper Band (Pure Yellow): Represents a **+10% deviation** above the fair value corridor, acting as a historical resistance zone during expansion phases.
Lower Band (Pure Green): Represents a **-10% deviation** below the fair value corridor, acting as the structural macro support floor.
Holographic Line (Glow White Dotted): Projects the model's current fair value coordinate smoothly across the active price bars.
Glow Shading: Dynamic, semi-transparent background color fills between the bands to visually isolate overvalued or undervalued territories easily.
---
⚙️ Configurable Inputs & Features
The script features a highly customizable input menu divided into functional groups:
🌐 Language Localizer: Fully multi-lingual interface supporting **English**, **Persian (فارسی)**, and **Kurdish (کوردی)** across the HUD table layout.
🌀 Toggle Visibility: Independent control switches to show or hide the Main Power Law line, Upper Band, Lower Band, Holographic Dotted Line, and Channel Glow Fills.
🔮 Custom Macro Targets: Allows you to input custom price expectations for key future cyclical milestones (**2026E**, **2030E**, and **2035E**) directly into the on-screen display panel.
🟢 Dynamic Buy Zone Percentage: Define custom deep-value accumulation triggers (Default is **18% below the lower band**).
📜 Historical Touch Tracker: Automates historical data tracking by searching through historical bars to identify and display exactly when Bitcoin hit its ultimate cycle floors.
---
📈 How to Use the Indicator for Trading & Investment
1. Identifying the Macro Buy Zone
When Bitcoin’s market price drops below the defined lower band offset percentage, the chart background dynamically shifts to a soft green shade. Historically, these moments represent generational accumulation phases (e.g., the absolute bottoms of macro bear markets).
2. Fair Value Tracking (The Mean Reversion Anchor)
The center red line acts as a strong gravity anchor. During bull market bubbles, price overextends aggressively above it; during capitulations, it snaps below it. Long-term positions can be assessed relative to whether the current price is trading at a premium or a discount to this red value line.
3. The On-Screen HUD Table
Positioned cleanly in the top-right corner of your screen, the Head-Up Display (HUD) table keeps you constantly updated on:
* The raw underlying power-law formula.
* The live asset **Fair Value** adjusted to the current day.
* Your personalized macro target projections for upcoming years.
* An integrated ledger highlighting exactly which **Cycle Touch Years** marked historical bottoms alongside their precise historical dollar-value floors.
4. Automated Alert System
The script comes equipped with an integrated alert condition trigger. You can set a native TradingView server alert for the event `🟢 Bitcoin BUY ZONE` to notify your desktop or mobile device the exact moment Bitcoin drops into the structural deep-value buying zone.
---
💻 Source Code Overview
The code leverages the latest **Pine Script v6** performance upgrades, introducing modern array mechanics to track cycle anomalies efficiently without slowing down chart rendering engines, capping maximum visual line, label, and box memory footprints safely at 500 units each.
The Kurdistani Bitcoin Power Law is a long-term macro analysis tool for Bitcoin (
BTC$), built entirely in **Pine Script v6**. It models Bitcoin's historical growth trajectory over time using a log-log power-law relationship, treating time not as a linear metric, but as an exponential driver of value.This script maps out Bitcoin's structural "Fair Value" alongside its cyclical boundaries, providing long-term investors with clear macroeconomic floors, ceilings, accumulation zones, and historical touch-points.
---
🔬 The Math Behind the Model
Unlike standard exponential models that eventually experience unrealistic vertical explosions, a power law models a diminishing growth rate over time.
The indicator calculates elapsed days since Bitcoin's Genesis Block (January 3, 2009) and uses the following regression formula to establish the center fair value band:
$$P(t) = 8.31 \times 10^{-17} \times t^{5.48}$$
Where $t$ represents the total number of days elapsed since the genesis block. This model boasts an incredibly high historical correlation coefficient ($R^2 = 0.9976$).
---
🎨 Visual Breakdown & Color Map
The chart overlays a structured channel designed for high visual clarity, utilizing a custom dark theme interface:
Center Line (Pure Red):The fundamental **Fair Value** anchor of the Power Law model.
Upper Band (Pure Yellow): Represents a **+10% deviation** above the fair value corridor, acting as a historical resistance zone during expansion phases.
Lower Band (Pure Green): Represents a **-10% deviation** below the fair value corridor, acting as the structural macro support floor.
Holographic Line (Glow White Dotted): Projects the model's current fair value coordinate smoothly across the active price bars.
Glow Shading: Dynamic, semi-transparent background color fills between the bands to visually isolate overvalued or undervalued territories easily.
---
⚙️ Configurable Inputs & Features
The script features a highly customizable input menu divided into functional groups:
🌐 Language Localizer: Fully multi-lingual interface supporting **English**, **Persian (فارسی)**, and **Kurdish (کوردی)** across the HUD table layout.
🌀 Toggle Visibility: Independent control switches to show or hide the Main Power Law line, Upper Band, Lower Band, Holographic Dotted Line, and Channel Glow Fills.
🔮 Custom Macro Targets: Allows you to input custom price expectations for key future cyclical milestones (**2026E**, **2030E**, and **2035E**) directly into the on-screen display panel.
🟢 Dynamic Buy Zone Percentage: Define custom deep-value accumulation triggers (Default is **18% below the lower band**).
📜 Historical Touch Tracker: Automates historical data tracking by searching through historical bars to identify and display exactly when Bitcoin hit its ultimate cycle floors.
---
📈 How to Use the Indicator for Trading & Investment
1. Identifying the Macro Buy Zone
When Bitcoin’s market price drops below the defined lower band offset percentage, the chart background dynamically shifts to a soft green shade. Historically, these moments represent generational accumulation phases (e.g., the absolute bottoms of macro bear markets).
2. Fair Value Tracking (The Mean Reversion Anchor)
The center red line acts as a strong gravity anchor. During bull market bubbles, price overextends aggressively above it; during capitulations, it snaps below it. Long-term positions can be assessed relative to whether the current price is trading at a premium or a discount to this red value line.
3. The On-Screen HUD Table
Positioned cleanly in the top-right corner of your screen, the Head-Up Display (HUD) table keeps you constantly updated on:
* The raw underlying power-law formula.
* The live asset **Fair Value** adjusted to the current day.
* Your personalized macro target projections for upcoming years.
* An integrated ledger highlighting exactly which **Cycle Touch Years** marked historical bottoms alongside their precise historical dollar-value floors.
4. Automated Alert System
The script comes equipped with an integrated alert condition trigger. You can set a native TradingView server alert for the event `🟢 Bitcoin BUY ZONE` to notify your desktop or mobile device the exact moment Bitcoin drops into the structural deep-value buying zone.
---
💻 Source Code Overview
The code leverages the latest **Pine Script v6** performance upgrades, introducing modern array mechanics to track cycle anomalies efficiently without slowing down chart rendering engines, capping maximum visual line, label, and box memory footprints safely at 500 units each.
オープンソーススクリプト
TradingViewの精神に則り、このスクリプトの作者はコードをオープンソースとして公開してくれました。トレーダーが内容を確認・検証できるようにという配慮です。作者に拍手を送りましょう!無料で利用できますが、コードの再公開はハウスルールに従う必要があります。

______________________________________
I am Omid Dabagchi Makri, an artificial intelligence and computer software engineer, I have been working in the field of market analysis especially in the field of digital currencies for many years.
Entekhab.Net
I am Omid Dabagchi Makri, an artificial intelligence and computer software engineer, I have been working in the field of market analysis especially in the field of digital currencies for many years.
Entekhab.Net
免責事項
これらの情報および投稿は、TradingViewが提供または承認する金融、投資、取引、またはその他の種類の助言もしくは推奨であることを意図したものではなく、またこれらに該当するものでもありません。詳細は利用規約をご覧ください。
オープンソーススクリプト
TradingViewの精神に則り、このスクリプトの作者はコードをオープンソースとして公開してくれました。トレーダーが内容を確認・検証できるようにという配慮です。作者に拍手を送りましょう!無料で利用できますが、コードの再公開はハウスルールに従う必要があります。
______________________________________
I am Omid Dabagchi Makri, an artificial intelligence and computer software engineer, I have been working in the field of market analysis especially in the field of digital currencies for many years.
Entekhab.Net
I am Omid Dabagchi Makri, an artificial intelligence and computer software engineer, I have been working in the field of market analysis especially in the field of digital currencies for many years.
Entekhab.Net
免責事項
これらの情報および投稿は、TradingViewが提供または承認する金融、投資、取引、またはその他の種類の助言もしくは推奨であることを意図したものではなく、またこれらに該当するものでもありません。詳細は利用規約をご覧ください。