OPEN-SOURCE SCRIPT
Bar Breakout with ATR
Bar Breakout with ATR — Multi-Timeframe Dashboard
Identifies high-quality breakout bars across multiple timeframes using a combination of ATR-based range filtering and IBS (Internal Bar Strength) confirmation.
How it works:
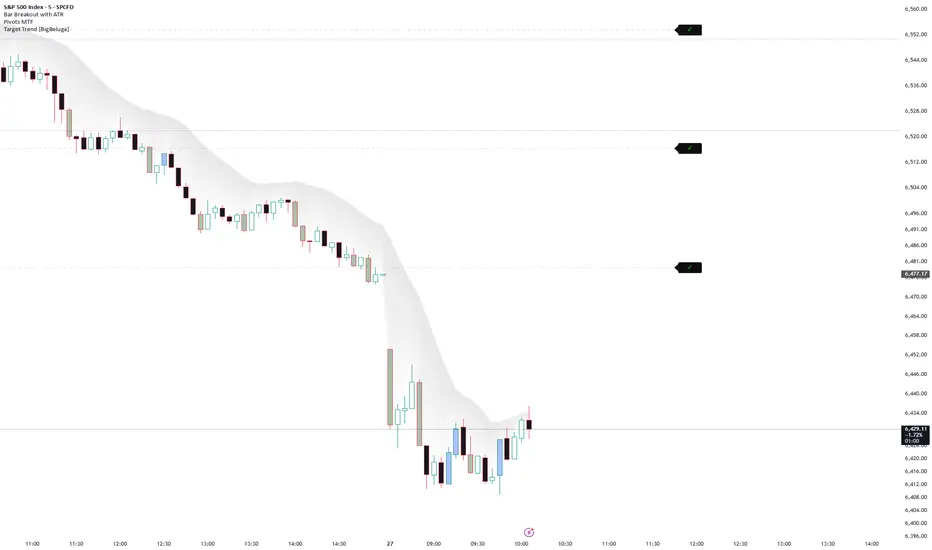
A bar is flagged as a breakout when three conditions align simultaneously — the close exceeds the prior bar's high (bull) or undercuts the prior bar's low (bear), the bar's range is at least N× the ATR, and the close quality is confirmed via IBS (top of range for bulls, bottom of range for bears). Bars that are large but fail to break are classified as POSS BULL or POSS BEAR — potential coiling setups worth watching.
Features:
Bar coloring — highlights confirmed breakout bars and large-range non-break bars in distinct colors
MTF Dashboard Table — shows the most recent breakout event (BULL BREAK, BEAR BREAK, POSS BULL, POSS BEAR) across up to 5 user-defined timeframes
Context rows — when the latest event on a timeframe is a POSS BULL/BEAR, the table optionally shows the last confirmed break for directional context
Per-bar detail — each table row displays timestamp (CST), low, high, range (with ATR multiple), midpoint, and IBS value
Fully configurable — ATR length, ATR multiplier, IBS thresholds, colors, table position, font sizes, and per-timeframe toggles
Best used on: Equity index futures (ES, NQ), ETFs, or any liquid instrument where breakout structure and range expansion are meaningful signals.
Identifies high-quality breakout bars across multiple timeframes using a combination of ATR-based range filtering and IBS (Internal Bar Strength) confirmation.
How it works:
A bar is flagged as a breakout when three conditions align simultaneously — the close exceeds the prior bar's high (bull) or undercuts the prior bar's low (bear), the bar's range is at least N× the ATR, and the close quality is confirmed via IBS (top of range for bulls, bottom of range for bears). Bars that are large but fail to break are classified as POSS BULL or POSS BEAR — potential coiling setups worth watching.
Features:
Bar coloring — highlights confirmed breakout bars and large-range non-break bars in distinct colors
MTF Dashboard Table — shows the most recent breakout event (BULL BREAK, BEAR BREAK, POSS BULL, POSS BEAR) across up to 5 user-defined timeframes
Context rows — when the latest event on a timeframe is a POSS BULL/BEAR, the table optionally shows the last confirmed break for directional context
Per-bar detail — each table row displays timestamp (CST), low, high, range (with ATR multiple), midpoint, and IBS value
Fully configurable — ATR length, ATR multiplier, IBS thresholds, colors, table position, font sizes, and per-timeframe toggles
Best used on: Equity index futures (ES, NQ), ETFs, or any liquid instrument where breakout structure and range expansion are meaningful signals.
オープンソーススクリプト
TradingViewの精神に則り、このスクリプトの作者はコードをオープンソースとして公開してくれました。トレーダーが内容を確認・検証できるようにという配慮です。作者に拍手を送りましょう!無料で利用できますが、コードの再公開はハウスルールに従う必要があります。

免責事項
これらの情報および投稿は、TradingViewが提供または承認する金融、投資、取引、またはその他の種類の助言もしくは推奨であることを意図したものではなく、またこれらに該当するものでもありません。詳細は利用規約をご覧ください。
オープンソーススクリプト
TradingViewの精神に則り、このスクリプトの作者はコードをオープンソースとして公開してくれました。トレーダーが内容を確認・検証できるようにという配慮です。作者に拍手を送りましょう!無料で利用できますが、コードの再公開はハウスルールに従う必要があります。
免責事項
これらの情報および投稿は、TradingViewが提供または承認する金融、投資、取引、またはその他の種類の助言もしくは推奨であることを意図したものではなく、またこれらに該当するものでもありません。詳細は利用規約をご覧ください。