OPEN-SOURCE SCRIPT
更新済 Syawal Vertical Lines
Indicator Description
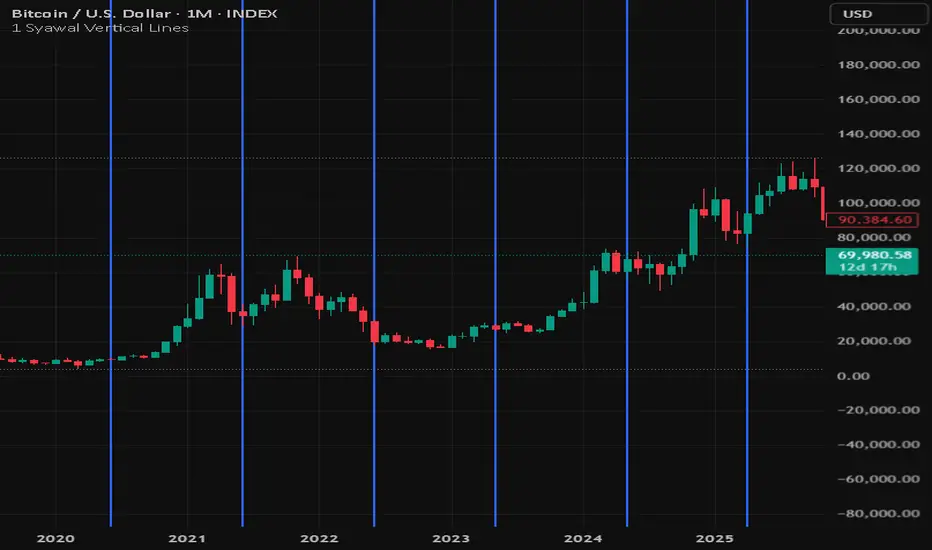
1 Shawwal Vertical Lines – Eid Mubarak Edition marks the date of 1 Shawwal (Eid al-Fitr) on the chart with vertical blue lines. Each line represents the day when Muslims around the world celebrate Eid Mubarak, the festival marking the end of Ramadan.
The dates are based on the conversion of the Islamic Hijri calendar to the Gregorian calendar for the period 2006–2025.
This indicator is designed to help traders and analysts explore potential seasonality and event-driven patterns in the market around major cultural and economic moments. Eid al-Fitr is often associated with shifts in economic activity, including:
- increased consumer spending
- changes in liquidity and market participation
- regional variations in trading behavior
By marking these dates directly on the chart, users can easily:
- identify where Eid al-Fitr occurs within market cycles
- compare market reactions across different years
- study potential holiday-related market behavior
The indicator works on all timeframes because it uses timestamp-based detection, ensuring the vertical lines appear correctly on daily, weekly, and monthly charts.
Features
- Vertical markers for 1 Shawwal (2006–2025)
- Works on all timeframes
- Useful for seasonality and event-based analysis
- Lightweight and does not rely on technical calculations
Note
The exact date of Eid al-Fitr may vary slightly between countries due to different lunar observation methods. The dates used in this indicator follow commonly accepted Hijri-to-Gregorian calendar conversions.
Eid Mubarak to everyone celebrating.
1 Shawwal Vertical Lines – Eid Mubarak Edition marks the date of 1 Shawwal (Eid al-Fitr) on the chart with vertical blue lines. Each line represents the day when Muslims around the world celebrate Eid Mubarak, the festival marking the end of Ramadan.
The dates are based on the conversion of the Islamic Hijri calendar to the Gregorian calendar for the period 2006–2025.
This indicator is designed to help traders and analysts explore potential seasonality and event-driven patterns in the market around major cultural and economic moments. Eid al-Fitr is often associated with shifts in economic activity, including:
- increased consumer spending
- changes in liquidity and market participation
- regional variations in trading behavior
By marking these dates directly on the chart, users can easily:
- identify where Eid al-Fitr occurs within market cycles
- compare market reactions across different years
- study potential holiday-related market behavior
The indicator works on all timeframes because it uses timestamp-based detection, ensuring the vertical lines appear correctly on daily, weekly, and monthly charts.
Features
- Vertical markers for 1 Shawwal (2006–2025)
- Works on all timeframes
- Useful for seasonality and event-based analysis
- Lightweight and does not rely on technical calculations
Note
The exact date of Eid al-Fitr may vary slightly between countries due to different lunar observation methods. The dates used in this indicator follow commonly accepted Hijri-to-Gregorian calendar conversions.
Eid Mubarak to everyone celebrating.
リリースノート
add/edit data for year 2026オープンソーススクリプト
TradingViewの精神に則り、このスクリプトの作者はコードをオープンソースとして公開してくれました。トレーダーが内容を確認・検証できるようにという配慮です。作者に拍手を送りましょう!無料で利用できますが、コードの再公開はハウスルールに従う必要があります。

免責事項
これらの情報および投稿は、TradingViewが提供または承認する金融、投資、取引、またはその他の種類の助言もしくは推奨であることを意図したものではなく、またこれらに該当するものでもありません。詳細は利用規約をご覧ください。
オープンソーススクリプト
TradingViewの精神に則り、このスクリプトの作者はコードをオープンソースとして公開してくれました。トレーダーが内容を確認・検証できるようにという配慮です。作者に拍手を送りましょう!無料で利用できますが、コードの再公開はハウスルールに従う必要があります。
免責事項
これらの情報および投稿は、TradingViewが提供または承認する金融、投資、取引、またはその他の種類の助言もしくは推奨であることを意図したものではなく、またこれらに該当するものでもありません。詳細は利用規約をご覧ください。