OPEN-SOURCE SCRIPT
Clean Key Levels Map
Clean Key Levels Map
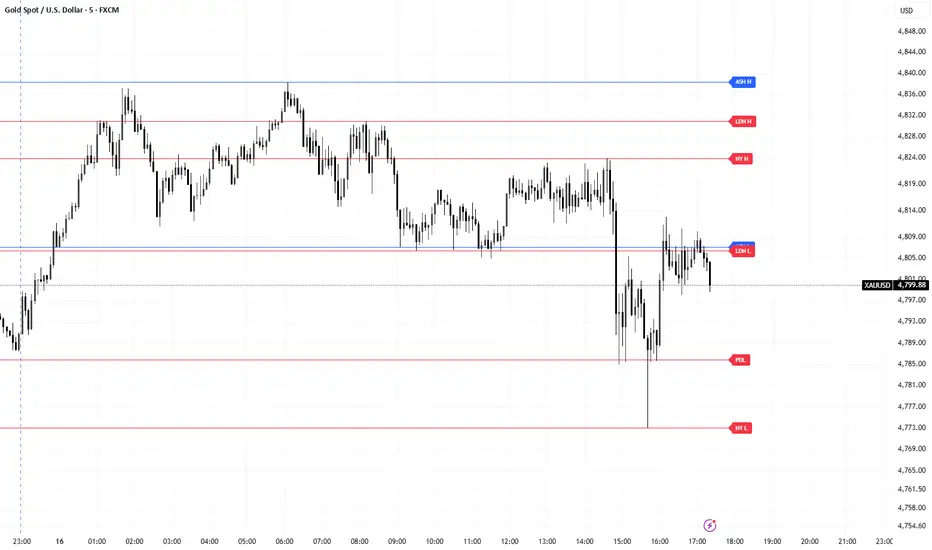
Clean Key Levels Map is a simple level-marking indicator designed for traders who want an uncluttered chart with only the most important reference prices.
This tool plots key levels from higher timeframes and major trading sessions, with short labels printed on the right side for quick identification. All lines begin from the start of the current trading day, which keeps the chart clean and structured for intraday decision-making.
Included levels
Previous Day High and Low
Previous NY Session High and Low
Asia Session High and Low
London Session High and Low
Weekly High and Low
Monthly High and Low
Features
Clean horizontal line layout
Short level names on the right side
Custom on/off toggle for each level group
Custom color selection for each level group
Adjustable line width
Adjustable label offset
Optional auto-delete of old levels on a new day
Built for traders who prefer a simple chart without unnecessary signals
Best use
This indicator is best used as a visual map for:
liquidity levels
session highs and lows
reaction zones
intraday context
breakout and sweep-based trading
It does not generate buy or sell signals. Its purpose is to help traders read price around important levels with clarity.
Notes
Previous NY High and Low are based on the defined NY session input
Asia and London levels are based on their completed session ranges
Weekly and Monthly levels are taken from the previous completed week and month
All lines are designed to start from the beginning of the current trading day for a cleaner intraday view
This indicator is ideal for traders who use price action, sweeps, session liquidity, ORB, or level-to-level trading and want a clean framework on the chart.
Clean Key Levels Map is a simple level-marking indicator designed for traders who want an uncluttered chart with only the most important reference prices.
This tool plots key levels from higher timeframes and major trading sessions, with short labels printed on the right side for quick identification. All lines begin from the start of the current trading day, which keeps the chart clean and structured for intraday decision-making.
Included levels
Previous Day High and Low
Previous NY Session High and Low
Asia Session High and Low
London Session High and Low
Weekly High and Low
Monthly High and Low
Features
Clean horizontal line layout
Short level names on the right side
Custom on/off toggle for each level group
Custom color selection for each level group
Adjustable line width
Adjustable label offset
Optional auto-delete of old levels on a new day
Built for traders who prefer a simple chart without unnecessary signals
Best use
This indicator is best used as a visual map for:
liquidity levels
session highs and lows
reaction zones
intraday context
breakout and sweep-based trading
It does not generate buy or sell signals. Its purpose is to help traders read price around important levels with clarity.
Notes
Previous NY High and Low are based on the defined NY session input
Asia and London levels are based on their completed session ranges
Weekly and Monthly levels are taken from the previous completed week and month
All lines are designed to start from the beginning of the current trading day for a cleaner intraday view
This indicator is ideal for traders who use price action, sweeps, session liquidity, ORB, or level-to-level trading and want a clean framework on the chart.
オープンソーススクリプト
TradingViewの精神に則り、このスクリプトの作者はコードをオープンソースとして公開してくれました。トレーダーが内容を確認・検証できるようにという配慮です。作者に拍手を送りましょう!無料で利用できますが、コードの再公開はハウスルールに従う必要があります。

免責事項
これらの情報および投稿は、TradingViewが提供または承認する金融、投資、取引、またはその他の種類の助言もしくは推奨であることを意図したものではなく、またこれらに該当するものでもありません。詳細は利用規約をご覧ください。
オープンソーススクリプト
TradingViewの精神に則り、このスクリプトの作者はコードをオープンソースとして公開してくれました。トレーダーが内容を確認・検証できるようにという配慮です。作者に拍手を送りましょう!無料で利用できますが、コードの再公開はハウスルールに従う必要があります。
免責事項
これらの情報および投稿は、TradingViewが提供または承認する金融、投資、取引、またはその他の種類の助言もしくは推奨であることを意図したものではなく、またこれらに該当するものでもありません。詳細は利用規約をご覧ください。