OPEN-SOURCE SCRIPT
アップデート済 Fusion EMA Trend Trade Planner
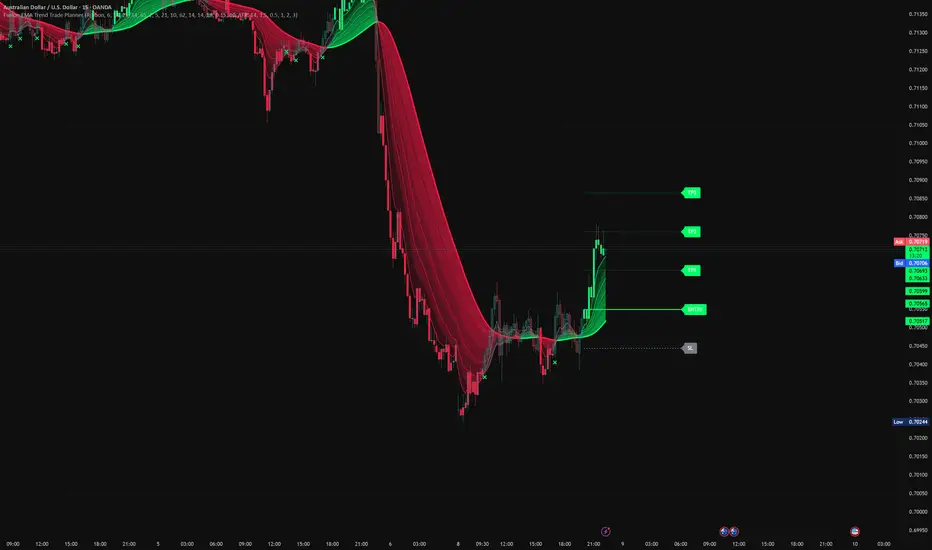
Fusion EMA Trend Trade Planner
Back to basics.
This tool was built for traders who want a cleaner way to read trend direction, avoid messy chop, and plan risk before entering a trade.
Instead of filling the chart with separate tools for trend, confirmation, filtering, and risk levels, this script combines those steps into one simple workflow.
The goal is not to predict the future.
The goal is to answer four basic questions:
• Is the market trending?
• Is the trend clean or messy?
• Does the broader context support the move?
• Where would entry, stop loss, and take profit levels sit?
━━━━━━━━━━━━━━━━━━━━
🔹 Core Idea
━━━━━━━━━━━━━━━━━━━━
Fusion EMA Trend Trade Planner is built around a simple trend-following process:
1. Find clean EMA structure.
2. Check the 21-period Basis Cloud.
3. Use optional filters if extra confirmation is wanted.
4. Plot a simple risk/reward trade plan.
5. Watch for trend deterioration.
━━━━━━━━━━━━━━━━━━━━
🔹 Fusion EMA Structure
━━━━━━━━━━━━━━━━━━━━
The main trend engine uses four exponential moving averages.
A bullish trend is shown when the EMAs are stacked cleanly:
Fast EMA > Medium EMA > Slow EMA > Anchor EMA
A bearish trend is shown when the EMAs are stacked the opposite way:
Fast EMA < Medium EMA < Slow EMA < Anchor EMA
This is different from a basic two-line crossover.
A single moving average can show direction, but a stacked EMA structure can show both direction and trend quality.
When the EMAs are separated and aligned, the trend structure is cleaner.
When the EMAs compress or cross, the market may be losing structure.
When the structure is mixed, candles can turn grey. This is a visual warning that the trend is no longer clean.
━━━━━━━━━━━━━━━━━━━━
🔹 Fusion Ribbon
━━━━━━━━━━━━━━━━━━━━
The ribbon shows the relationship between the four EMAs.
When the ribbon is clean and expanded, trend structure is stronger.
When the ribbon compresses or turns grey, the market may be entering chop, transition, or weak trend conditions.
This makes it easier for newer traders to visually separate:
• Clean trend
• Weak trend
• Choppy market
━━━━━━━━━━━━━━━━━━━━
🔹 21-Period Basis Cloud
━━━━━━━━━━━━━━━━━━━━
The Basis Cloud is built around a smoothed 21-period basis average.
The number 21 was chosen because it is a Fibonacci number commonly used by trend traders as an intermediate market rhythm.
The cloud also uses a shorter reference average to create a layered visual zone around the basis.
The Basis Cloud is not designed as a simple crossover signal.
Its job is to act as a directional context layer.
In simple terms:
• Green cloud = basis direction is rising
• Red cloud = basis direction is falling
The Fusion EMA Structure and Basis Cloud are calculated separately.
This means traders can compare two different views of the market:
• EMA trend structure
• 21-period basis direction
When both agree, the setup has cleaner directional context.
When they disagree, conditions may be weaker or less clear.
━━━━━━━━━━━━━━━━━━━━
🔹 Higher Timeframe Filter
━━━━━━━━━━━━━━━━━━━━
An optional higher timeframe Fusion EMA can be used for extra context.
This helps traders avoid taking setups that go directly against broader trend structure.
For example:
• Current chart is bullish
• Higher timeframe is also bullish
• Setup has better alignment
This does not guarantee success, but it helps keep trades in line with the bigger picture.
━━━━━━━━━━━━━━━━━━━━
🔹 Optional Quality Filter
━━━━━━━━━━━━━━━━━━━━
The script includes an optional Quality Filter for traders who prefer additional confirmation.
By default, the indicator focuses on Fusion EMA Structure, Basis Cloud direction, and Trade Planning.
For traders who want a more selective approach, the Quality Filter can be enabled to evaluate:
• EMA ribbon expansion
• Price position relative to the Basis Cloud
• Higher timeframe agreement
• ADX trend strength
The filter is not intended to predict win rates or assign confidence scores.
Its purpose is simply to reduce participation during weaker trend conditions.
Many traders may prefer to leave the filter disabled and use Fusion EMA Structure and Basis Cloud alignment alone.
━━━━━━━━━━━━━━━━━━━━
🔹 Trade Planner
━━━━━━━━━━━━━━━━━━━━
When a valid setup appears, the script can draw a full trade plan:
• Entry
• Stop Loss
• TP1
• TP2
• TP3
Stop loss can be calculated using:
• ATR-based stop
• Percentage-based stop
Take-profit levels are based on adjustable risk/reward values.
This helps traders see the risk before entering instead of chasing candles blindly.
The Trade Planner is a visual planning tool only. It does not place trades automatically.
━━━━━━━━━━━━━━━━━━━━
🔹 Grey Exit Marker
━━━━━━━━━━━━━━━━━━━━
If a trade is active and the EMA structure turns grey, the script can print a small X marker.
This means the original clean trend structure has weakened.
It does not mean price must reverse.
It simply means the condition that created the trade setup is no longer clean.
━━━━━━━━━━━━━━━━━━━━
🔹 Suggested Workflow
━━━━━━━━━━━━━━━━━━━━
For a bullish setup:
1. Wait for green candle structure.
2. Check that the ribbon is clean.
3. Check that price is above the Basis Cloud.
4. Use the optional Quality Filter if you want extra confirmation.
5. Use the Trade Planner to review entry, stop loss, and targets.
6. Watch for grey candles or exit markers.
For a bearish setup:
1. Wait for red candle structure.
2. Check that the ribbon is clean.
3. Check that price is below the Basis Cloud.
4. Use the optional Quality Filter if you want extra confirmation.
5. Use the Trade Planner to review entry, stop loss, and targets.
6. Watch for grey candles or exit markers.
━━━━━━━━━━━━━━━━━━━━
🔹 Originality
━━━━━━━━━━━━━━━━━━━━
This script was designed as a complete trend-following workflow, not as a random collection of indicators.
The goal of this script was not to merge unrelated indicators into a single chart.
Each component was selected to perform a specific role within the workflow:
• Fusion EMA Structure identifies trend alignment.
• Fusion Ribbon visualizes trend quality.
• 21-Period Basis Cloud provides directional context.
• Optional Quality Filter helps reduce participation during weaker conditions.
• Trade Planner converts trend conditions into predefined risk levels.
• Grey Exit Marker highlights trend deterioration.
Together, these components form a single trend-analysis and trade-planning process rather than functioning as separate standalone indicators.
The purpose is to move from trend reading to trade planning in one clean process.
━━━━━━━━━━━━━━━━━━━━
🔹 Important Notes
━━━━━━━━━━━━━━━━━━━━
This indicator does not:
• Predict future price movement
• Guarantee profitable trades
• Estimate win probability
• Replace risk management
• Call every top or bottom
It is designed to help traders identify cleaner trend conditions and plan trades more consistently.
Simple idea:
Find the trend.
Check the structure.
Plan the risk.
Do not chase messy candles.
Back to basics.
This tool was built for traders who want a cleaner way to read trend direction, avoid messy chop, and plan risk before entering a trade.
Instead of filling the chart with separate tools for trend, confirmation, filtering, and risk levels, this script combines those steps into one simple workflow.
The goal is not to predict the future.
The goal is to answer four basic questions:
• Is the market trending?
• Is the trend clean or messy?
• Does the broader context support the move?
• Where would entry, stop loss, and take profit levels sit?
━━━━━━━━━━━━━━━━━━━━
🔹 Core Idea
━━━━━━━━━━━━━━━━━━━━
Fusion EMA Trend Trade Planner is built around a simple trend-following process:
1. Find clean EMA structure.
2. Check the 21-period Basis Cloud.
3. Use optional filters if extra confirmation is wanted.
4. Plot a simple risk/reward trade plan.
5. Watch for trend deterioration.
━━━━━━━━━━━━━━━━━━━━
🔹 Fusion EMA Structure
━━━━━━━━━━━━━━━━━━━━
The main trend engine uses four exponential moving averages.
A bullish trend is shown when the EMAs are stacked cleanly:
Fast EMA > Medium EMA > Slow EMA > Anchor EMA
A bearish trend is shown when the EMAs are stacked the opposite way:
Fast EMA < Medium EMA < Slow EMA < Anchor EMA
This is different from a basic two-line crossover.
A single moving average can show direction, but a stacked EMA structure can show both direction and trend quality.
When the EMAs are separated and aligned, the trend structure is cleaner.
When the EMAs compress or cross, the market may be losing structure.
When the structure is mixed, candles can turn grey. This is a visual warning that the trend is no longer clean.
━━━━━━━━━━━━━━━━━━━━
🔹 Fusion Ribbon
━━━━━━━━━━━━━━━━━━━━
The ribbon shows the relationship between the four EMAs.
When the ribbon is clean and expanded, trend structure is stronger.
When the ribbon compresses or turns grey, the market may be entering chop, transition, or weak trend conditions.
This makes it easier for newer traders to visually separate:
• Clean trend
• Weak trend
• Choppy market
━━━━━━━━━━━━━━━━━━━━
🔹 21-Period Basis Cloud
━━━━━━━━━━━━━━━━━━━━
The Basis Cloud is built around a smoothed 21-period basis average.
The number 21 was chosen because it is a Fibonacci number commonly used by trend traders as an intermediate market rhythm.
The cloud also uses a shorter reference average to create a layered visual zone around the basis.
The Basis Cloud is not designed as a simple crossover signal.
Its job is to act as a directional context layer.
In simple terms:
• Green cloud = basis direction is rising
• Red cloud = basis direction is falling
The Fusion EMA Structure and Basis Cloud are calculated separately.
This means traders can compare two different views of the market:
• EMA trend structure
• 21-period basis direction
When both agree, the setup has cleaner directional context.
When they disagree, conditions may be weaker or less clear.
━━━━━━━━━━━━━━━━━━━━
🔹 Higher Timeframe Filter
━━━━━━━━━━━━━━━━━━━━
An optional higher timeframe Fusion EMA can be used for extra context.
This helps traders avoid taking setups that go directly against broader trend structure.
For example:
• Current chart is bullish
• Higher timeframe is also bullish
• Setup has better alignment
This does not guarantee success, but it helps keep trades in line with the bigger picture.
━━━━━━━━━━━━━━━━━━━━
🔹 Optional Quality Filter
━━━━━━━━━━━━━━━━━━━━
The script includes an optional Quality Filter for traders who prefer additional confirmation.
By default, the indicator focuses on Fusion EMA Structure, Basis Cloud direction, and Trade Planning.
For traders who want a more selective approach, the Quality Filter can be enabled to evaluate:
• EMA ribbon expansion
• Price position relative to the Basis Cloud
• Higher timeframe agreement
• ADX trend strength
The filter is not intended to predict win rates or assign confidence scores.
Its purpose is simply to reduce participation during weaker trend conditions.
Many traders may prefer to leave the filter disabled and use Fusion EMA Structure and Basis Cloud alignment alone.
━━━━━━━━━━━━━━━━━━━━
🔹 Trade Planner
━━━━━━━━━━━━━━━━━━━━
When a valid setup appears, the script can draw a full trade plan:
• Entry
• Stop Loss
• TP1
• TP2
• TP3
Stop loss can be calculated using:
• ATR-based stop
• Percentage-based stop
Take-profit levels are based on adjustable risk/reward values.
This helps traders see the risk before entering instead of chasing candles blindly.
The Trade Planner is a visual planning tool only. It does not place trades automatically.
━━━━━━━━━━━━━━━━━━━━
🔹 Grey Exit Marker
━━━━━━━━━━━━━━━━━━━━
If a trade is active and the EMA structure turns grey, the script can print a small X marker.
This means the original clean trend structure has weakened.
It does not mean price must reverse.
It simply means the condition that created the trade setup is no longer clean.
━━━━━━━━━━━━━━━━━━━━
🔹 Suggested Workflow
━━━━━━━━━━━━━━━━━━━━
For a bullish setup:
1. Wait for green candle structure.
2. Check that the ribbon is clean.
3. Check that price is above the Basis Cloud.
4. Use the optional Quality Filter if you want extra confirmation.
5. Use the Trade Planner to review entry, stop loss, and targets.
6. Watch for grey candles or exit markers.
For a bearish setup:
1. Wait for red candle structure.
2. Check that the ribbon is clean.
3. Check that price is below the Basis Cloud.
4. Use the optional Quality Filter if you want extra confirmation.
5. Use the Trade Planner to review entry, stop loss, and targets.
6. Watch for grey candles or exit markers.
━━━━━━━━━━━━━━━━━━━━
🔹 Originality
━━━━━━━━━━━━━━━━━━━━
This script was designed as a complete trend-following workflow, not as a random collection of indicators.
The goal of this script was not to merge unrelated indicators into a single chart.
Each component was selected to perform a specific role within the workflow:
• Fusion EMA Structure identifies trend alignment.
• Fusion Ribbon visualizes trend quality.
• 21-Period Basis Cloud provides directional context.
• Optional Quality Filter helps reduce participation during weaker conditions.
• Trade Planner converts trend conditions into predefined risk levels.
• Grey Exit Marker highlights trend deterioration.
Together, these components form a single trend-analysis and trade-planning process rather than functioning as separate standalone indicators.
The purpose is to move from trend reading to trade planning in one clean process.
━━━━━━━━━━━━━━━━━━━━
🔹 Important Notes
━━━━━━━━━━━━━━━━━━━━
This indicator does not:
• Predict future price movement
• Guarantee profitable trades
• Estimate win probability
• Replace risk management
• Call every top or bottom
It is designed to help traders identify cleaner trend conditions and plan trades more consistently.
Simple idea:
Find the trend.
Check the structure.
Plan the risk.
Do not chase messy candles.
リリースノート
Update NotesThis update introduces a new EMA Alignment Mode, allowing traders to choose between 2-EMA, 3-EMA, or 4-EMA trend confirmation.
What's New:
• Added EMA Alignment Mode selector (2 EMA, 3 EMA, 4 EMA)
• Fusion trend calculations now adapt automatically to the selected mode
• Higher Timeframe Fusion calculations now follow the selected alignment mode
• Improved trade management and trend-holding logic
Trade Management Improvement:
Entries can now be triggered using faster EMA alignment modes, while exits continue to monitor the complete 4-EMA structure.
This allows:
• Earlier trend participation
• Greater tolerance to normal pullbacks
• Longer trend capture during strong directional moves
• Reduced premature exits compared to previous versions
The goal of this update is to provide more flexibility while preserving the original Fusion concept of identifying clean trend structure and managing trades through trend alignment.
Special thanks to MohaveTrader for the idea and contribution behind the EMA Alignment Mode and enhanced trade-holding logic. Credit where credit is due.
リリースノート
update some logic and improve labels visualオープンソーススクリプト
TradingViewの精神に則り、このスクリプトの作者はコードをオープンソースとして公開してくれました。トレーダーが内容を確認・検証できるようにという配慮です。作者に拍手を送りましょう!無料で利用できますが、コードの再公開はハウスルールに従う必要があります。

免責事項
これらの情報および投稿は、TradingViewが提供または承認する金融、投資、取引、またはその他の種類の助言もしくは推奨であることを意図したものではなく、またこれらに該当するものでもありません。詳細は利用規約をご覧ください。
オープンソーススクリプト
TradingViewの精神に則り、このスクリプトの作者はコードをオープンソースとして公開してくれました。トレーダーが内容を確認・検証できるようにという配慮です。作者に拍手を送りましょう!無料で利用できますが、コードの再公開はハウスルールに従う必要があります。
免責事項
これらの情報および投稿は、TradingViewが提供または承認する金融、投資、取引、またはその他の種類の助言もしくは推奨であることを意図したものではなく、またこれらに該当するものでもありません。詳細は利用規約をご覧ください。