アップデート済
Unbroke Auto S/R Zones
TITLE:
Unbroke Auto S/R Zones
DESCRIPTION (paste everything below this line):
Unbroke Auto S/R Zones is a drawing aid that builds support and resistance zones automatically from confirmed swing highs and lows, and a stats panel that counts what price did at those zones compared with random levels.
What it does
How to read it
A touch is price coming back to an eligible zone (at least 2 swings) from one side. Over the next 12 bars the outcome is:
The Proof panel
Inputs
1. Zones (pivot bars, merge distance, padding, min swings, max breaks, max age, half-life, memory, start date), 2. Display (zones shown, distance filter, glow, labels, panel position and size), 3. Proof (reaction size, window, min touches, forward start, registered read, random levels, seed), 4. Export.
Limitations
Forward test
Live forward test running on NQ1! 5m with default settings from Oct 26, 2026; one registered read on Jan 31, 2027 (end of day ET), or earlier once zones and the random-level average both reach 400 touches. It passes if the bootstrap 95% CI lower bound of the difference is above 0 and the zone rate is above the 97.5th percentile of the 20 random lanes.
Originality
Original Pine Script v6 code by Unbroke, open-source under MPL 2.0. Zone building, the same-side random-level baseline and the scoring rules are our own design. No third-party code is used.
Educational, not financial advice. Past results don't predict future results.
Unbroke Auto S/R Zones
DESCRIPTION (paste everything below this line):
Unbroke Auto S/R Zones is a drawing aid that builds support and resistance zones automatically from confirmed swing highs and lows, and a stats panel that counts what price did at those zones compared with random levels.
What it does
- Finds swing highs/lows (5 bars left, 5 right). A swing is used only on the bar that confirms it, so it appears 5 bars late and never moves. Zone boxes are drawn with the zone's current top and bottom back to where the zone became eligible; if later swings widen a zone, its past box widens too. Touch statistics use only what was known on each bar.
- A new swing within 0.5 ATR(14) of an existing zone joins that zone; otherwise it starts a new one (padded by 0.1 ATR).
- A close above a zone makes it support, a close below makes it resistance. Each flip counts as a break; a zone is removed after more than 2 breaks, or after 600 bars without a new swing.
- Strength = number of swings in the zone, fading with a 300-bar half-life. Stronger zones are drawn more solid; the nearest zone on each side can glow.
- Shows up to 6 zones within 6 ATR of price, with labels.
How to read it
A touch is price coming back to an eligible zone (at least 2 swings) from one side. Over the next 12 bars the outcome is:
- Break: a close through the far side (checked first).
- Reaction: price moves 0.5 ATR away on the side it came from.
- Neither: 12 bars pass.
The Proof panel
- For every zone, 20 random levels are placed on the same side of price with the same width and age rules, and scored with the identical touch rules.
- The panel (default Bottom Center) shows the zone reaction rate, the random rate and the sample size. Rows under 20 touches show "insufficient data"; under 30 are marked small sample.
- History before the forward start (Oct 26, 2026) is descriptive only: it was seen while building the tool.
- Intervals are approximate: touches cluster in time, so they are narrower than they should be. The detailed panel says so.
Inputs
1. Zones (pivot bars, merge distance, padding, min swings, max breaks, max age, half-life, memory, start date), 2. Display (zones shown, distance filter, glow, labels, panel position and size), 3. Proof (reaction size, window, min touches, forward start, registered read, random levels, seed), 4. Export.
Limitations
- Zones lag by the confirmation delay (5 bars by default).
- A zone is a reference area, not a prediction. Zones break often.
- Random levels are on average slightly narrower than real zones, and some zones near price get no random levels; both are disclosed and reported at the read.
- Results depend on the history your plan loads.
Forward test
Live forward test running on NQ1! 5m with default settings from Oct 26, 2026; one registered read on Jan 31, 2027 (end of day ET), or earlier once zones and the random-level average both reach 400 touches. It passes if the bootstrap 95% CI lower bound of the difference is above 0 and the zone rate is above the 97.5th percentile of the 20 random lanes.
Originality
Original Pine Script v6 code by Unbroke, open-source under MPL 2.0. Zone building, the same-side random-level baseline and the scoring rules are our own design. No third-party code is used.
Educational, not financial advice. Past results don't predict future results.
リリースノート
In simple terms: what it does and how to use it- Add it to your chart. It draws support and resistance zones for you: price areas where price turned around before. A zone is built from swing highs and lows (tops and bottoms) and appears 5 bars after the turn, once it is confirmed. It does not jump around afterwards.
- Zones below price are support (places price bounced up from before); zones above price are resistance (places price was pushed down from before). Stronger zones, with more turns in them, are drawn more solid.
- When price comes back to a zone, watch what it does: bounce away, or close through it. A close through is a break, and the zone may flip sides. A zone is an area to pay attention to, not a promise. Zones break often.
- The Proof panel compares how often price reacted at the zones with random price levels on the same chart. If the two numbers are close, the zones are doing no better than chance there.
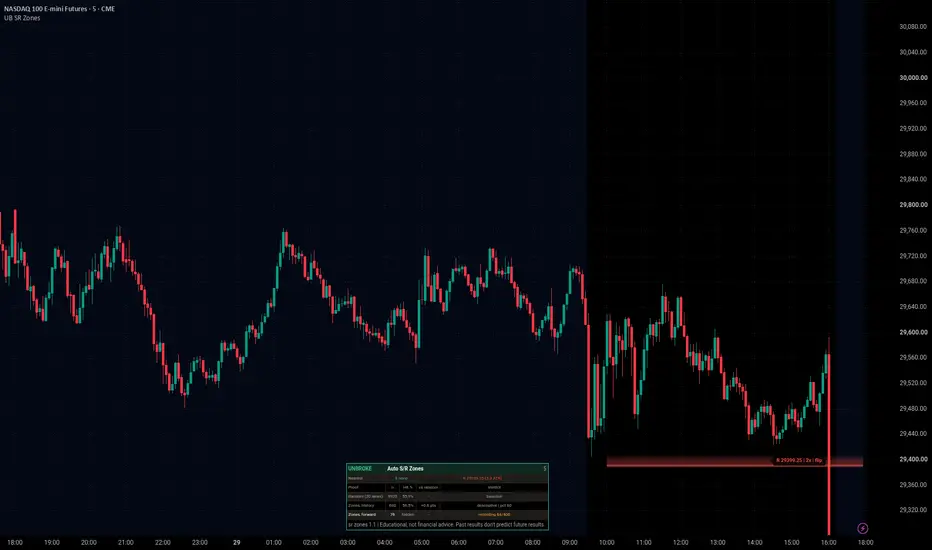
Example chart:
Green zone = support, a price area where buyers stepped in before; red zone = resistance, where sellers pushed price down before. Watch whether price bounces off a zone or closes through it, and compare with the random row in the panel.

免責事項
これらの情報および投稿は、TradingViewが提供または承認する金融、投資、取引、またはその他の種類の助言もしくは推奨であることを意図したものではなく、またこれらに該当するものでもありません。詳細は利用規約をご覧ください。
免責事項
これらの情報および投稿は、TradingViewが提供または承認する金融、投資、取引、またはその他の種類の助言もしくは推奨であることを意図したものではなく、またこれらに該当するものでもありません。詳細は利用規約をご覧ください。