Nick's IB Break/Extension/Retest v3
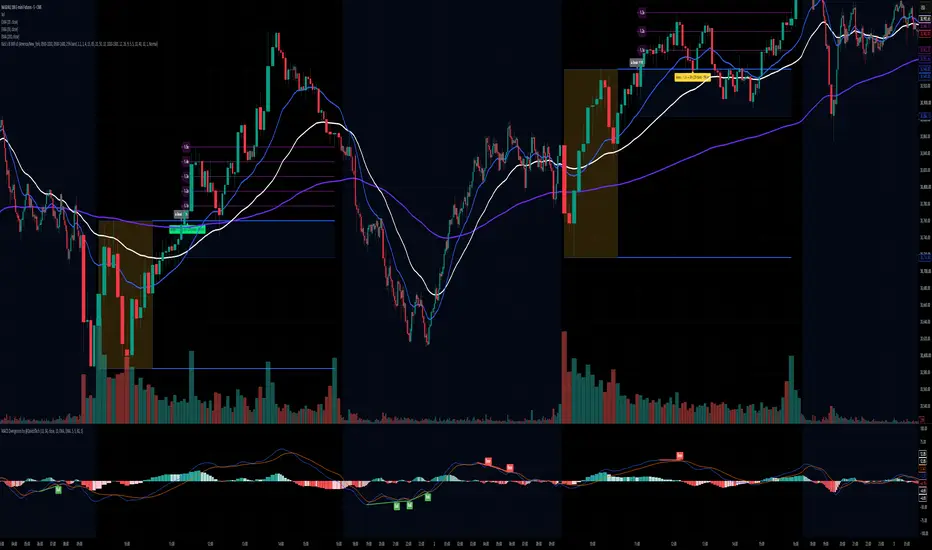
Initial Balance — Break / Extension / Retest (with continuation odds)
This indicator turns the first-hour Initial Balance behavior into a live decision-support tool. It marks the IB (09:30–10:30 ET by default), watches for the post-10:30 break, tracks how far price extends beyond the IB in fractions of the IB range (1.1× to 1.5×), and flags the first retest back to the IB level — then stamps the historical continuation base rate for the extension that was reached, colored by depth (shallow retests = green/likely re-entry, deep retests = red/likely top).
The continuation percentages are drawn from TradingStats 12-year NQ IB study. They are reach/continuation rates, not win rates — no stops or targets are modeled. Treat the numbers as context for a discretionary decision, not a signal with a proven edge.
Filters (all optional, all toggleable): a regime-EMA gate (only flag breaks that agree with the trend), a break-timing window, a minimum-extension requirement, MACD divergence (pre-kill before the retest + post-void after), and a MACD slope/level kill with an immediate-slope reprieve. Killed setups are tagged with the reason so you can see which filter acted. An optional RSI pop/dip trigger flags a precise entry after a valid retest.
Intrabar note (important): break/extension/retest/entry are detected by walking the 1-minute path inside each chart bar, so the sequence is read in true order rather than inferred from bar OHLC. As a result, signals on the currently-forming bar update as 1-minute bars print and are final only on bar close. Historical signals do not change. Run on a 3–15 minute chart (the chart timeframe must be higher than the intrabar timeframe).
Credits: continuation statistics from the TradingStats 12-year NQ first-hour IB study.

免責事項
これらの情報および投稿は、TradingViewが提供または承認する金融、投資、取引、またはその他の種類の助言もしくは推奨であることを意図したものではなく、またこれらに該当するものでもありません。詳細は利用規約をご覧ください。
免責事項
これらの情報および投稿は、TradingViewが提供または承認する金融、投資、取引、またはその他の種類の助言もしくは推奨であることを意図したものではなく、またこれらに該当するものでもありません。詳細は利用規約をご覧ください。