OI Candle by Umut
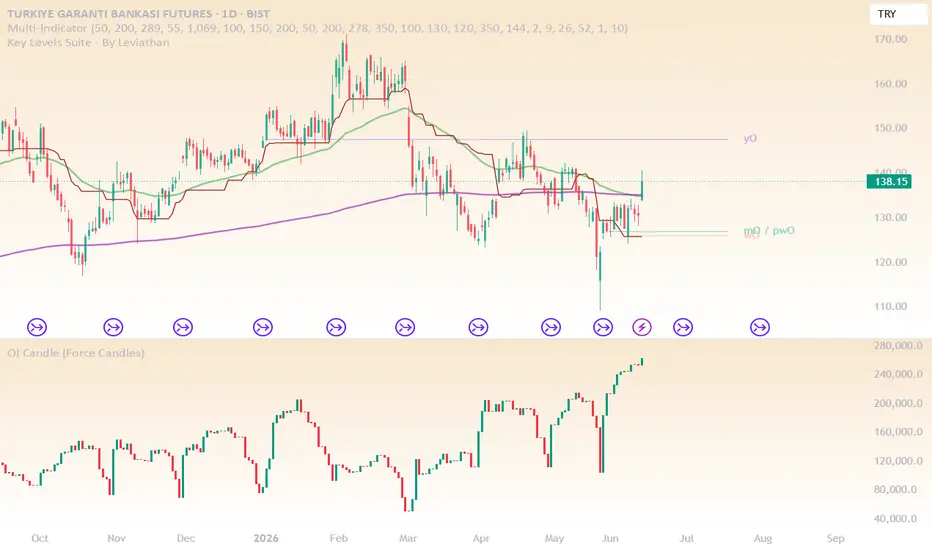
This indicator displays Open Interest (OI) as candlestick data across all timeframes, giving traders a clearer view of market participation and positioning dynamics.
Unlike standard OI indicators that use line charts or are limited to higher timeframes, this version visualizes OI using full OHLC candles. This allows you to analyze volatility, momentum, and structural changes in open interest in the same way as price action.
Unlike standard OI indicators that use line charts or are limited to higher timeframes, this version visualizes OI using full OHLC candles. This allows you to analyze volatility, momentum, and structural changes in open interest in the same way as price action.

免責事項
これらの情報および投稿は、TradingViewが提供または承認する金融、投資、取引、またはその他の種類の助言もしくは推奨であることを意図したものではなく、またこれらに該当するものでもありません。詳細は利用規約をご覧ください。
免責事項
これらの情報および投稿は、TradingViewが提供または承認する金融、投資、取引、またはその他の種類の助言もしくは推奨であることを意図したものではなく、またこれらに該当するものでもありません。詳細は利用規約をご覧ください。