Smart Money Concepts Suite [QuantAlgo]
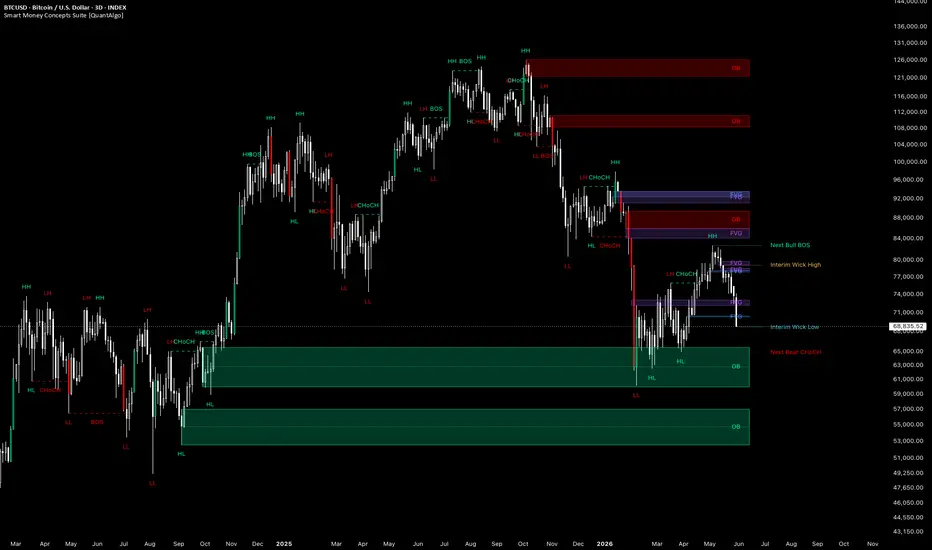
🟢 Overview
The Smart Money Concepts Suite is a complete market structure and institutional footprint toolkit built for traders who follow the Smart Money Concepts (SMC) methodology. It maps the underlying trend skeleton through confirmed swing pivots, marks breaks of structure and changes of character, projects the price levels that would trigger the next structural shift, and overlays the key zones institutional order flow tends to leave behind, including fair value gaps and order blocks. Everything calculates natively on whatever timeframe your chart is set to, so the entire suite follows you from scalping charts to swing and position timeframes with a single click.

🟢 What Are Smart Money Concepts?
Smart Money Concepts (SMC) is a framework for reading price through the lens of institutional behaviour rather than traditional retail indicators. The core idea is that large participants leave recognisable patterns in the way price builds and breaks structure: higher highs and higher lows in an uptrend, lower highs and lower lows in a downtrend, and a shift in that rhythm when control changes hands. SMC traders watch for breaks of structure that confirm a trend is continuing, changes of character that warn a reversal may be underway, and imbalances or unmitigated zones where price is likely to return before its next move. Read together, these elements offer a structured way to anticipate where price may be drawn, rather than simply reacting after the fact.

🟢 How It Works
The indicator continuously scans price for confirmed swing pivots and uses them to build a live picture of market structure. When price closes through a prior swing, the script registers a structural event and labels it as either a Break of Structure (continuation of the prevailing trend, BOS) or a Change of Character (a potential reversal where control has flipped, CHoCH). Because events are evaluated on bar close by default, the structure is non-repainting and suitable for alerts.
From the most recently confirmed swings, the suite forward-projects the exact price levels that would trigger the next break, labelling each as the next bullish or bearish BOS or CHoCH. These are anticipatory levels to watch, not confirmed signals, and each clears automatically the moment price trades through it. Alongside structure, the indicator detects fair value gaps (three-bar imbalances price often revisits) and order blocks (the last opposite-colour candle before an impulsive move that breaks structure, marking a likely institutional zone). Both can be configured to disappear once mitigated or remain on the chart for historical reference. A separate impulse engine tints candles whose size is large relative to a recent baseline, highlighting the momentum bars that frequently precede structural breaks.

🟢 Key Features
▶ Quick Start Presets
Three preset configurations let you apply the suite without tuning every setting. "Scalping" uses sensitive swing detection, tight gap boxes, merged and shrinking gaps, eager mitigation, and a lower impulse threshold, suited to fast intraday charts. "Swing Trading" uses less sensitive swing detection, full-size gap boxes, consolidated zones, stricter mitigation, and a higher impulse threshold, suited to higher timeframes. "Custom (Default)" hands full manual control of every setting back to you. When a preset is active it overrides only the strategy-relevant settings, while all colour and visual choices always follow your own preferences.

▶ Market Structure Mapping
The suite plots HH, HL, LH, and LL labels at each confirmed swing pivot, drawing the trend skeleton directly on your chart. Confirmed breaks are marked with a structure line and a BOS or CHoCH label so you can see at a glance whether the most recent move continued the trend or signalled a shift in control. Swing sensitivity is fully adjustable through a single lookback setting.

▶ Projected Next Levels
Rather than only reacting after a break happens, the indicator forward-projects the swing high and swing low as the levels that would trigger the next structural event, labelling each as a continuation (BOS) or reversal (CHoCH). Line style, width, colour, and forward extension are all configurable.

▶ Fair Value Gaps
Three-bar imbalances are drawn as zones price frequently returns to fill. You can filter gaps live by their position relative to price (all, above, or below the close), choose Full wick-to-wick or Tight box sizing so large impulse candles produce compact zones, and merge overlapping same-direction gaps with an adjustable overlap threshold to prevent clutter. Gaps can be hidden on mitigation or kept permanently, with three projection modes, configurable border, label, and maximum count.

▶ Order Blocks
The suite identifies the originating candle behind each impulsive break and marks it as a likely institutional order zone, with an optional 50% equilibrium midline traders often use as an entry reference. Blocks can be hidden on mitigation or kept on the chart, projected forward in three modes, and capped at a maximum count to keep the chart readable. Search depth, border width, and labels are all adjustable.

▶ Mitigation Modes
Both fair value gaps and order blocks share a Mitigation Basis control: Wick (touch) treats a zone as mitigated the moment price trades through its edge, while Close (body) requires a bar to close beyond it for stricter confirmation. Fair value gaps additionally offer a Binary mode (full original box until completely filled) or a Shrink mode that erodes the box down to only the unfilled portion as price probes it, so you always see the live remaining imbalance.

▶ Interim Wicks
The suite can track the running highest and lowest extremes beyond confirmed structure, marking the liquidity probes that often precede or follow a break. The measurement window can reset on each new pivot, on each confirmed break, or run over a fixed lookback, and you can measure from wicks or bodies, display the leading extreme or the runner-up probe behind it, and show the line only when it genuinely sits beyond structure.

▶ Impulse Candles
Candles whose range or body is large relative to a recent average are tinted to highlight impulsive momentum that often precedes structural breaks. You can measure by full range or body only, tune the averaging length and the multiple required to qualify, and optionally require a strong body to filter out long-wicked indecision bars.

▶ Detection Timing
A single timing control lets you choose how events are confirmed. Confirmed (bar close) evaluates everything once the bar has closed so nothing repaints, which is the safe default and the correct setting for alerts. Live (intrabar) evaluates conditions on every tick so you can observe events as they develop in real time, with the understanding they may change before the bar closes.

▶ Color Presets
Five built-in colour presets (Classic, Aqua, Cosmic, Cyber, Neon) let you match the suite to your chart with a single click, applying a uniform bull and bear colour across every element. A Custom preset exposes individual colour pickers for structure, projected levels, interim wicks, fair value gaps, order blocks, and impulse candles, alongside transparency controls and adjustable label text size.

▶ Built-in Alert System
A comprehensive set of pre-configured alerts covers bullish and bearish BOS, bullish and bearish CHoCH, any structure break, fair value gaps forming, first touch, and full mitigation, order blocks forming, first touch, and full mitigation, interim highs and lows being taken, and bullish or bearish impulse candles. Each alert message includes the exchange, ticker, and timeframe, so you can monitor the structural events that matter most across multiple charts at once. For automated use, pair alerts with the Once Per Bar Close condition.

The Smart Money Concepts Suite is a complete market structure and institutional footprint toolkit built for traders who follow the Smart Money Concepts (SMC) methodology. It maps the underlying trend skeleton through confirmed swing pivots, marks breaks of structure and changes of character, projects the price levels that would trigger the next structural shift, and overlays the key zones institutional order flow tends to leave behind, including fair value gaps and order blocks. Everything calculates natively on whatever timeframe your chart is set to, so the entire suite follows you from scalping charts to swing and position timeframes with a single click.
🟢 What Are Smart Money Concepts?
Smart Money Concepts (SMC) is a framework for reading price through the lens of institutional behaviour rather than traditional retail indicators. The core idea is that large participants leave recognisable patterns in the way price builds and breaks structure: higher highs and higher lows in an uptrend, lower highs and lower lows in a downtrend, and a shift in that rhythm when control changes hands. SMC traders watch for breaks of structure that confirm a trend is continuing, changes of character that warn a reversal may be underway, and imbalances or unmitigated zones where price is likely to return before its next move. Read together, these elements offer a structured way to anticipate where price may be drawn, rather than simply reacting after the fact.
🟢 How It Works
The indicator continuously scans price for confirmed swing pivots and uses them to build a live picture of market structure. When price closes through a prior swing, the script registers a structural event and labels it as either a Break of Structure (continuation of the prevailing trend, BOS) or a Change of Character (a potential reversal where control has flipped, CHoCH). Because events are evaluated on bar close by default, the structure is non-repainting and suitable for alerts.
From the most recently confirmed swings, the suite forward-projects the exact price levels that would trigger the next break, labelling each as the next bullish or bearish BOS or CHoCH. These are anticipatory levels to watch, not confirmed signals, and each clears automatically the moment price trades through it. Alongside structure, the indicator detects fair value gaps (three-bar imbalances price often revisits) and order blocks (the last opposite-colour candle before an impulsive move that breaks structure, marking a likely institutional zone). Both can be configured to disappear once mitigated or remain on the chart for historical reference. A separate impulse engine tints candles whose size is large relative to a recent baseline, highlighting the momentum bars that frequently precede structural breaks.
🟢 Key Features
▶ Quick Start Presets
Three preset configurations let you apply the suite without tuning every setting. "Scalping" uses sensitive swing detection, tight gap boxes, merged and shrinking gaps, eager mitigation, and a lower impulse threshold, suited to fast intraday charts. "Swing Trading" uses less sensitive swing detection, full-size gap boxes, consolidated zones, stricter mitigation, and a higher impulse threshold, suited to higher timeframes. "Custom (Default)" hands full manual control of every setting back to you. When a preset is active it overrides only the strategy-relevant settings, while all colour and visual choices always follow your own preferences.
▶ Market Structure Mapping
The suite plots HH, HL, LH, and LL labels at each confirmed swing pivot, drawing the trend skeleton directly on your chart. Confirmed breaks are marked with a structure line and a BOS or CHoCH label so you can see at a glance whether the most recent move continued the trend or signalled a shift in control. Swing sensitivity is fully adjustable through a single lookback setting.
▶ Projected Next Levels
Rather than only reacting after a break happens, the indicator forward-projects the swing high and swing low as the levels that would trigger the next structural event, labelling each as a continuation (BOS) or reversal (CHoCH). Line style, width, colour, and forward extension are all configurable.
▶ Fair Value Gaps
Three-bar imbalances are drawn as zones price frequently returns to fill. You can filter gaps live by their position relative to price (all, above, or below the close), choose Full wick-to-wick or Tight box sizing so large impulse candles produce compact zones, and merge overlapping same-direction gaps with an adjustable overlap threshold to prevent clutter. Gaps can be hidden on mitigation or kept permanently, with three projection modes, configurable border, label, and maximum count.
▶ Order Blocks
The suite identifies the originating candle behind each impulsive break and marks it as a likely institutional order zone, with an optional 50% equilibrium midline traders often use as an entry reference. Blocks can be hidden on mitigation or kept on the chart, projected forward in three modes, and capped at a maximum count to keep the chart readable. Search depth, border width, and labels are all adjustable.
▶ Mitigation Modes
Both fair value gaps and order blocks share a Mitigation Basis control: Wick (touch) treats a zone as mitigated the moment price trades through its edge, while Close (body) requires a bar to close beyond it for stricter confirmation. Fair value gaps additionally offer a Binary mode (full original box until completely filled) or a Shrink mode that erodes the box down to only the unfilled portion as price probes it, so you always see the live remaining imbalance.
▶ Interim Wicks
The suite can track the running highest and lowest extremes beyond confirmed structure, marking the liquidity probes that often precede or follow a break. The measurement window can reset on each new pivot, on each confirmed break, or run over a fixed lookback, and you can measure from wicks or bodies, display the leading extreme or the runner-up probe behind it, and show the line only when it genuinely sits beyond structure.
▶ Impulse Candles
Candles whose range or body is large relative to a recent average are tinted to highlight impulsive momentum that often precedes structural breaks. You can measure by full range or body only, tune the averaging length and the multiple required to qualify, and optionally require a strong body to filter out long-wicked indecision bars.
▶ Detection Timing
A single timing control lets you choose how events are confirmed. Confirmed (bar close) evaluates everything once the bar has closed so nothing repaints, which is the safe default and the correct setting for alerts. Live (intrabar) evaluates conditions on every tick so you can observe events as they develop in real time, with the understanding they may change before the bar closes.
▶ Color Presets
Five built-in colour presets (Classic, Aqua, Cosmic, Cyber, Neon) let you match the suite to your chart with a single click, applying a uniform bull and bear colour across every element. A Custom preset exposes individual colour pickers for structure, projected levels, interim wicks, fair value gaps, order blocks, and impulse candles, alongside transparency controls and adjustable label text size.
▶ Built-in Alert System
A comprehensive set of pre-configured alerts covers bullish and bearish BOS, bullish and bearish CHoCH, any structure break, fair value gaps forming, first touch, and full mitigation, order blocks forming, first touch, and full mitigation, interim highs and lows being taken, and bullish or bearish impulse candles. Each alert message includes the exchange, ticker, and timeframe, so you can monitor the structural events that matter most across multiple charts at once. For automated use, pair alerts with the Once Per Bar Close condition.
有料スペースでご利用いただけます
このインジケーターは QuantAlgo Essential の有料会員限定です。購読すれば、QuantAlgoの他のスクリプトもご利用いただけます。

🟢 Access our best trading & investing tools: joinquantalgo.com/plans
🟢 Free Special Edition indicators: joinquantalgo.com/special-editions
🟢 Discord: discord.gg/hJaFyGEAyX
🟢 Free Special Edition indicators: joinquantalgo.com/special-editions
🟢 Discord: discord.gg/hJaFyGEAyX
免責事項
これらの情報および投稿は、TradingViewが提供または承認する金融、投資、取引、またはその他の種類の助言もしくは推奨であることを意図したものではなく、またこれらに該当するものでもありません。詳細は利用規約をご覧ください。
有料スペースでご利用いただけます
このインジケーターは QuantAlgo Essential の有料会員限定です。購読すれば、QuantAlgoの他のスクリプトもご利用いただけます。
🟢 Access our best trading & investing tools: joinquantalgo.com/plans
🟢 Free Special Edition indicators: joinquantalgo.com/special-editions
🟢 Discord: discord.gg/hJaFyGEAyX
🟢 Free Special Edition indicators: joinquantalgo.com/special-editions
🟢 Discord: discord.gg/hJaFyGEAyX
免責事項
これらの情報および投稿は、TradingViewが提供または承認する金融、投資、取引、またはその他の種類の助言もしくは推奨であることを意図したものではなく、またこれらに該当するものでもありません。詳細は利用規約をご覧ください。