OPEN-SOURCE SCRIPT
Gaspard98 - Bollinger Bands - RSI
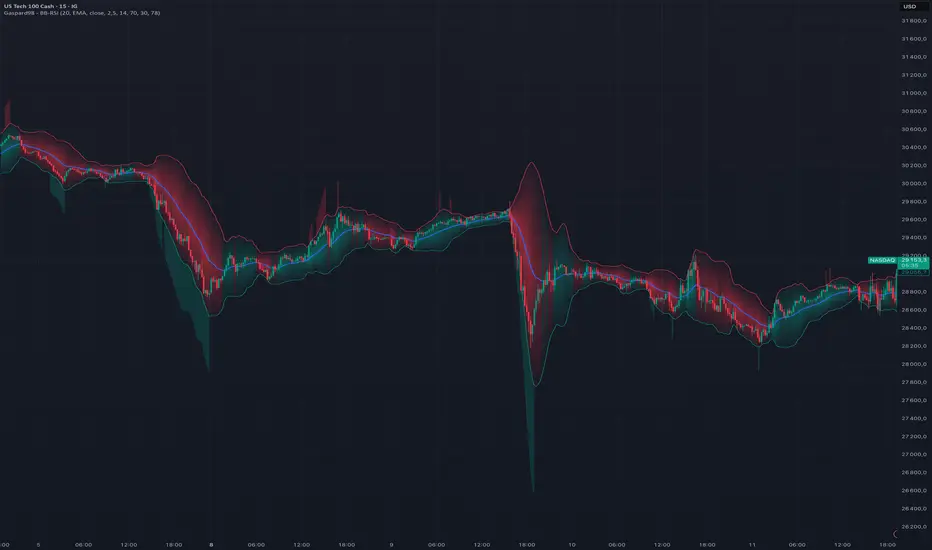
# Gaspard98 — Bollinger Bands · RSI
**Bollinger Bands reimagined: a dynamic trend background painted inside the bands, and overbought/oversold RSI readings projected directly outside them.**
---
## Overview
This indicator takes the classic Bollinger Bands and adds two layers of visual reading designed to help you decide faster, without leaving the price chart:
1. **A dynamic trend background** painted *only inside* the bands (between the upper band, the basis, and the lower band). Its color shows the bias (bullish / bearish) and its **intensity changes in real time** with the strength of the move.
2. **Overbought / oversold (RSI) zones** projected *above and below* the bands, lighting up only when the RSI crosses its thresholds. This lets you combine volatility (Bollinger) and momentum (RSI) at a single glance, without a separate oscillator at the bottom of the screen.
The goal: keep the readability of a clean chart while making the context (trend + momentum extremes) immediately obvious.
---
## The concept
Bollinger Bands measure volatility around a moving average, but on their own they say nothing about either **directional bias** or **momentum state**. This tool fills both gaps directly on the overlay:
- **Trend** — price above the basis = bullish context; below = bearish context. The background turns this bias into color.
- **Strength** — the further price moves from the basis relative to current volatility, the denser the background — a sign that a push is either fading or accelerating.
- **Momentum extremes** — the RSI flags overbought/oversold zones. Instead of a separate panel, the information is brought back onto the price, exactly where it matters.
---
## How it works
### 1. Bollinger Bands
Basis = a moving average (SMA, EMA, SMMA/RMA, WMA or VWMA, your choice). The upper and lower bands sit at `± StdDev × standard deviation` from the basis. Standard settings: length 20, multiplier 2.0.
### 2. Dynamic trend background
The background is gradient-based: dense color at the basis, fading progressively toward each band, creating a "trend core" effect rather than a flat fill.
- **Green** when price is above the basis (bullish bias).
- **Red** when price is below it (bearish bias).
- In **dynamic intensity** mode, the background density is derived from `|price − basis| / standard deviation`. In practice: a trend that pushes hard produces a vivid background, a market reverting to its mean produces a more subdued one.
### 3. RSI OB/OS zones (outside the bands)
An RSI computed in the background triggers two colored zones projected outside the bands:
- **Red zone above the upper band** when the RSI reaches the **overbought** threshold.
- **Green zone below the lower band** when the RSI reaches the **oversold** threshold.
These zones only appear on the bars where the condition is met, making them a punctual marker rather than a permanent fill.
---
## Inputs
**Bollinger**
- *Length* — moving-average period (default 20).
- *Basis MA Type* — moving-average type: SMA, EMA, SMMA (RMA), WMA, VWMA.
- *Source* — calculation source (default: close).
- *StdDev* — standard-deviation multiplier for band width (default 2.0).
**Trend**
- *Color inside the bands* — toggles the background on/off.
- *Dynamic intensity* — modulates density by strength; off = constant fill.
- *Bullish / Bearish* — customizable colors.
**RSI**
- *OB/OS zones outside bands* — toggles the zones on/off.
- *RSI Length* — RSI period (default 14).
- *Overbought (OB)* — upper threshold (default 70).
- *Oversold (OS)* — lower threshold (default 30).
- *Zone transparency* — opacity of the projections.
---
## How to use it
- **Read the context first.** A dense green background = bullish push underway; a background that pales as price returns toward the basis = loss of momentum / mean reversion.
- **Spot the extremes.** A red zone above the upper band (RSI overbought) while price tags that band signals possible exhaustion; the mirror logic applies to the green oversold zone.
- **Combine both signals.** The most telling context appears when background and RSI zone line up: for example, a bullish background that intensifies *without* triggering overbought suggests a healthy trend; a bullish background *with* clear overbought at the upper band calls for more caution.
Adapt the RSI thresholds and the multiplier to your instrument and timeframe. The defaults suit indices and CFDs on intraday timeframes but deserve tuning to the volatility of the underlying.
---
## Originality
Most Bollinger derivatives simply color the space between the bands or add crossover signals. Here, two specific ideas:
- The background is **bounded inside the bands** and **gradient-mapped around the basis**, with intensity indexed to volatility — not a binary solid fill, but a continuous reading of strength.
- The RSI zones are **projected outside the bands** rather than shown in a separate panel, fusing momentum and volatility onto a single reading plane.
---
## Disclaimer
This indicator is a market-reading and visualization tool. It does not constitute investment advice or a buy/sell recommendation. Past performance is not indicative of future results. You remain solely responsible for your decisions and your risk management.
---
*Published by Gaspard98. Feedback and suggestions welcome in the comments.*
**Bollinger Bands reimagined: a dynamic trend background painted inside the bands, and overbought/oversold RSI readings projected directly outside them.**
---
## Overview
This indicator takes the classic Bollinger Bands and adds two layers of visual reading designed to help you decide faster, without leaving the price chart:
1. **A dynamic trend background** painted *only inside* the bands (between the upper band, the basis, and the lower band). Its color shows the bias (bullish / bearish) and its **intensity changes in real time** with the strength of the move.
2. **Overbought / oversold (RSI) zones** projected *above and below* the bands, lighting up only when the RSI crosses its thresholds. This lets you combine volatility (Bollinger) and momentum (RSI) at a single glance, without a separate oscillator at the bottom of the screen.
The goal: keep the readability of a clean chart while making the context (trend + momentum extremes) immediately obvious.
---
## The concept
Bollinger Bands measure volatility around a moving average, but on their own they say nothing about either **directional bias** or **momentum state**. This tool fills both gaps directly on the overlay:
- **Trend** — price above the basis = bullish context; below = bearish context. The background turns this bias into color.
- **Strength** — the further price moves from the basis relative to current volatility, the denser the background — a sign that a push is either fading or accelerating.
- **Momentum extremes** — the RSI flags overbought/oversold zones. Instead of a separate panel, the information is brought back onto the price, exactly where it matters.
---
## How it works
### 1. Bollinger Bands
Basis = a moving average (SMA, EMA, SMMA/RMA, WMA or VWMA, your choice). The upper and lower bands sit at `± StdDev × standard deviation` from the basis. Standard settings: length 20, multiplier 2.0.
### 2. Dynamic trend background
The background is gradient-based: dense color at the basis, fading progressively toward each band, creating a "trend core" effect rather than a flat fill.
- **Green** when price is above the basis (bullish bias).
- **Red** when price is below it (bearish bias).
- In **dynamic intensity** mode, the background density is derived from `|price − basis| / standard deviation`. In practice: a trend that pushes hard produces a vivid background, a market reverting to its mean produces a more subdued one.
### 3. RSI OB/OS zones (outside the bands)
An RSI computed in the background triggers two colored zones projected outside the bands:
- **Red zone above the upper band** when the RSI reaches the **overbought** threshold.
- **Green zone below the lower band** when the RSI reaches the **oversold** threshold.
These zones only appear on the bars where the condition is met, making them a punctual marker rather than a permanent fill.
---
## Inputs
**Bollinger**
- *Length* — moving-average period (default 20).
- *Basis MA Type* — moving-average type: SMA, EMA, SMMA (RMA), WMA, VWMA.
- *Source* — calculation source (default: close).
- *StdDev* — standard-deviation multiplier for band width (default 2.0).
**Trend**
- *Color inside the bands* — toggles the background on/off.
- *Dynamic intensity* — modulates density by strength; off = constant fill.
- *Bullish / Bearish* — customizable colors.
**RSI**
- *OB/OS zones outside bands* — toggles the zones on/off.
- *RSI Length* — RSI period (default 14).
- *Overbought (OB)* — upper threshold (default 70).
- *Oversold (OS)* — lower threshold (default 30).
- *Zone transparency* — opacity of the projections.
---
## How to use it
- **Read the context first.** A dense green background = bullish push underway; a background that pales as price returns toward the basis = loss of momentum / mean reversion.
- **Spot the extremes.** A red zone above the upper band (RSI overbought) while price tags that band signals possible exhaustion; the mirror logic applies to the green oversold zone.
- **Combine both signals.** The most telling context appears when background and RSI zone line up: for example, a bullish background that intensifies *without* triggering overbought suggests a healthy trend; a bullish background *with* clear overbought at the upper band calls for more caution.
Adapt the RSI thresholds and the multiplier to your instrument and timeframe. The defaults suit indices and CFDs on intraday timeframes but deserve tuning to the volatility of the underlying.
---
## Originality
Most Bollinger derivatives simply color the space between the bands or add crossover signals. Here, two specific ideas:
- The background is **bounded inside the bands** and **gradient-mapped around the basis**, with intensity indexed to volatility — not a binary solid fill, but a continuous reading of strength.
- The RSI zones are **projected outside the bands** rather than shown in a separate panel, fusing momentum and volatility onto a single reading plane.
---
## Disclaimer
This indicator is a market-reading and visualization tool. It does not constitute investment advice or a buy/sell recommendation. Past performance is not indicative of future results. You remain solely responsible for your decisions and your risk management.
---
*Published by Gaspard98. Feedback and suggestions welcome in the comments.*
オープンソーススクリプト
TradingViewの精神に則り、このスクリプトの作者はコードをオープンソースとして公開してくれました。トレーダーが内容を確認・検証できるようにという配慮です。作者に拍手を送りましょう!無料で利用できますが、コードの再公開はハウスルールに従う必要があります。

免責事項
これらの情報および投稿は、TradingViewが提供または承認する金融、投資、取引、またはその他の種類の助言もしくは推奨であることを意図したものではなく、またこれらに該当するものでもありません。詳細は利用規約をご覧ください。
オープンソーススクリプト
TradingViewの精神に則り、このスクリプトの作者はコードをオープンソースとして公開してくれました。トレーダーが内容を確認・検証できるようにという配慮です。作者に拍手を送りましょう!無料で利用できますが、コードの再公開はハウスルールに従う必要があります。
免責事項
これらの情報および投稿は、TradingViewが提供または承認する金融、投資、取引、またはその他の種類の助言もしくは推奨であることを意図したものではなく、またこれらに該当するものでもありません。詳細は利用規約をご覧ください。