Splurge vs Invest: What a Purchase Would Be Worth Invested
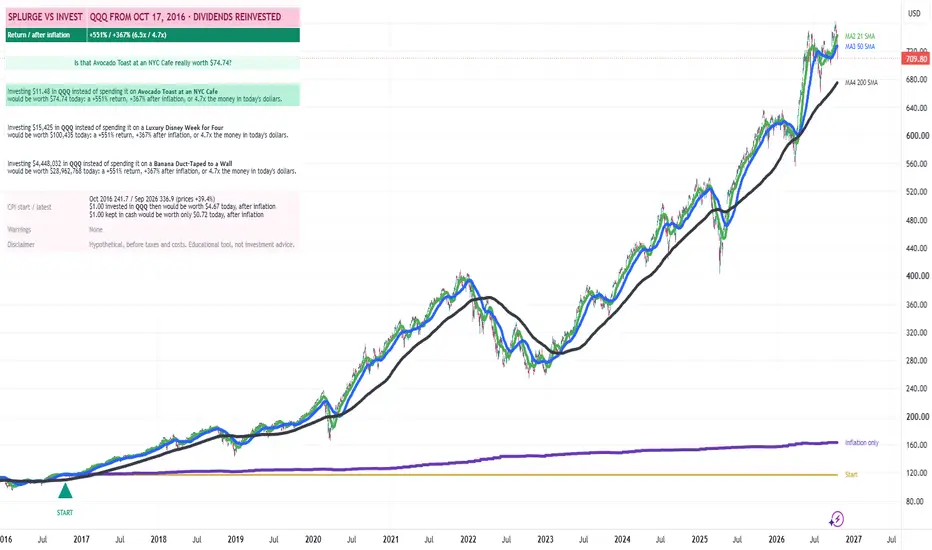
What would that avocado toast, new phone or dream vacation be worth today if the money had gone into the stock or ETF on your chart instead? Splurge vs Invest answers that on a daily chart. It scales a purchase's price back to a start date with the US Consumer Price Index, "invests" that amount at the start day's close, and shows what it would be worth now, before and after inflation.
It's a perspective tool for long-term investors and anyone curious about the real cost of everyday spending. All results are hypothetical.
What it shows
• An info table. By default it opens with a question about the selected item, for example "Is that Avocado Toast at an NYC Cafe really worth …?", followed by three plain-language examples from the cheapest to the priciest purchase. If the investment fell behind the purchase, the wording says so: "You'd have been better off enjoying that Avocado Toast at an NYC Cafe!"
• The symbol's return over the period, before and after inflation.
• A CPI row: the start and latest CPI values, what $1.00 invested at the start would be worth today after inflation, and what $1.00 kept in cash would be worth.
• A Start line at the start day's close, marked START.
• An Inflation line: where the price would be if it had only kept pace with inflation since the start. Candles above it are ahead of inflation; candles below it are behind.
• Optional moving averages: the 21, 50 and 200 SMA by default, with a 9 EMA available.
• Painted candles in eight color schemes and seven table color themes.

How to use
1. Open a daily chart of a stock or ETF.
2. Choose a Category, such as Food & drink, Gaming & tech, Travel, Cars or Over the top, or All for one headline item from each category.
3. Choose the Start: 5, 10 or 20 years ago, the first bar on the chart, or a date of your choice.
4. Change any category's headline item under Headline items, or enter Your item: a name, today's cost in US dollars, and One-time or Per year (a habit invested monthly).
5. Untick Show all items to focus the table on the selected item.
6. Switch Table format between Detailed (sentences) and Compact (one row per item), and adjust Text size, Table colors and Candle colors. Untick Candles to show the chart's own candles.
How it's calculated
• Purchase prices: 85 built-in items in 13 categories, at typical US prices from October 2026, anchored to the September 2026 CPI. They carry forward automatically as new CPI data is published.
• Inflation: each price is scaled back to the start month with the US CPI for All Urban Consumers, not seasonally adjusted (FRED:CPIAUCNS), the series the BLS CPI Inflation Calculator uses. This gives the same buying power at the start; it isn't the historical price of that exact item.
• One-time items: the start-date amount buys the symbol at the start day's close, and its value today is that holding at today's close.
• Per-year items: a twelfth of the yearly cost, in that month's dollars, is invested on the first trading day of each month from the start.
• Dividends: by default the script uses dividend-adjusted prices, so dividends are reinvested on their ex-dates, whatever your chart's ADJ setting. Untick Reinvest dividends for price change only. The candles show prices without dividends unless your chart's ADJ is on, so the table can show more growth than the candles.
• After inflation: the return multiplied by (CPI at the start ÷ the latest CPI).
• Symbols outside the US: prices are converted to US dollars, so returns include currency moves. The Warnings row notes the conversion.
• History: if the chart's history starts after the chosen date, the first available bar is used and the Warnings row says so.

Limitations
• Results are hypothetical, before taxes, trading costs and fees. Past results do not predict future results.
• Built for daily charts; intraday history is too short.
• Item prices are estimates of typical US prices and vary by place and time.
• CPI is published monthly with a short delay, so the most recent weeks use the latest available month.
This is an educational tool, not investment or financial advice.
It's a perspective tool for long-term investors and anyone curious about the real cost of everyday spending. All results are hypothetical.
What it shows
• An info table. By default it opens with a question about the selected item, for example "Is that Avocado Toast at an NYC Cafe really worth …?", followed by three plain-language examples from the cheapest to the priciest purchase. If the investment fell behind the purchase, the wording says so: "You'd have been better off enjoying that Avocado Toast at an NYC Cafe!"
• The symbol's return over the period, before and after inflation.
• A CPI row: the start and latest CPI values, what $1.00 invested at the start would be worth today after inflation, and what $1.00 kept in cash would be worth.
• A Start line at the start day's close, marked START.
• An Inflation line: where the price would be if it had only kept pace with inflation since the start. Candles above it are ahead of inflation; candles below it are behind.
• Optional moving averages: the 21, 50 and 200 SMA by default, with a 9 EMA available.
• Painted candles in eight color schemes and seven table color themes.
How to use
1. Open a daily chart of a stock or ETF.
2. Choose a Category, such as Food & drink, Gaming & tech, Travel, Cars or Over the top, or All for one headline item from each category.
3. Choose the Start: 5, 10 or 20 years ago, the first bar on the chart, or a date of your choice.
4. Change any category's headline item under Headline items, or enter Your item: a name, today's cost in US dollars, and One-time or Per year (a habit invested monthly).
5. Untick Show all items to focus the table on the selected item.
6. Switch Table format between Detailed (sentences) and Compact (one row per item), and adjust Text size, Table colors and Candle colors. Untick Candles to show the chart's own candles.
How it's calculated
• Purchase prices: 85 built-in items in 13 categories, at typical US prices from October 2026, anchored to the September 2026 CPI. They carry forward automatically as new CPI data is published.
• Inflation: each price is scaled back to the start month with the US CPI for All Urban Consumers, not seasonally adjusted (FRED:CPIAUCNS), the series the BLS CPI Inflation Calculator uses. This gives the same buying power at the start; it isn't the historical price of that exact item.
• One-time items: the start-date amount buys the symbol at the start day's close, and its value today is that holding at today's close.
• Per-year items: a twelfth of the yearly cost, in that month's dollars, is invested on the first trading day of each month from the start.
• Dividends: by default the script uses dividend-adjusted prices, so dividends are reinvested on their ex-dates, whatever your chart's ADJ setting. Untick Reinvest dividends for price change only. The candles show prices without dividends unless your chart's ADJ is on, so the table can show more growth than the candles.
• After inflation: the return multiplied by (CPI at the start ÷ the latest CPI).
• Symbols outside the US: prices are converted to US dollars, so returns include currency moves. The Warnings row notes the conversion.
• History: if the chart's history starts after the chosen date, the first available bar is used and the Warnings row says so.
Limitations
• Results are hypothetical, before taxes, trading costs and fees. Past results do not predict future results.
• Built for daily charts; intraday history is too short.
• Item prices are estimates of typical US prices and vary by place and time.
• CPI is published monthly with a short delay, so the most recent weeks use the latest available month.
This is an educational tool, not investment or financial advice.

J. Stephen Castellano · research-driven tools for investors and traders. Educational only, not financial advice. More: seekingalpha.com/author/stephen-castellano
免責事項
これらの情報および投稿は、TradingViewが提供または承認する金融、投資、取引、またはその他の種類の助言もしくは推奨であることを意図したものではなく、またこれらに該当するものでもありません。詳細は利用規約をご覧ください。
J. Stephen Castellano · research-driven tools for investors and traders. Educational only, not financial advice. More: seekingalpha.com/author/stephen-castellano
免責事項
これらの情報および投稿は、TradingViewが提供または承認する金融、投資、取引、またはその他の種類の助言もしくは推奨であることを意図したものではなく、またこれらに該当するものでもありません。詳細は利用規約をご覧ください。