CPC - Conformal Price Cone
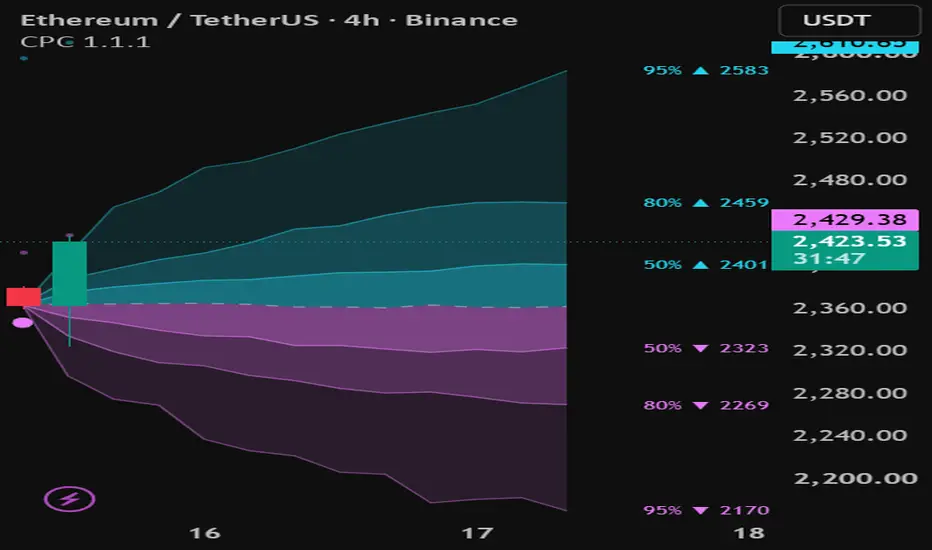
CPC is a historical price-distribution visualizer. It projects empirical ranges for future closing prices from the last confirmed candle, helping you compare the scale and asymmetry of past movements with the current market's volatility.
It is a market-context tool. It does not provide entries, take-profit levels, stop-loss levels, position sizing, or a risk-management system.
Reading the cone
The three nested bands show central empirical intervals at each future bar:
- 50%: the 25th to 75th percentiles.
- 80%: the 10th to 90th percentiles.
- 95%: the 2.5th to 97.5th percentiles.
Cyan shows the area above the pointwise median; magenta shows the area below it. These colors are not buy/sell signals. The dashed line connects the median closing-price estimate at each horizon; it is not the most likely trajectory.
The bands can be asymmetric because positive and negative historical returns are sampled together without imposing a symmetric distribution. A longer lower tail indicates larger downside outcomes in the sample, not automatically a higher probability of falling.
Percentages describe the full lower-to-upper interval. An 80% band does not mean an 80% probability of reaching its upper edge. The bands concern closes at individual horizons, not wick extremes, target-touch probabilities, or containment of the entire future path. Actual future coverage can differ substantially from the labels.
Chart example
On an ETHUSDT 4-hour chart with a 12-bar horizon, the right edge represents 48 hours ahead in this continuously traded market. Read each vertical slice as a separate future-close interval. The endpoint labels are the interval boundaries at bar 12.
For a simple hypothetical example, suppose the 80% endpoint labels are 2,300 and 2,600. Those numbers describe the central historical distribution after volatility scaling. They do not imply an 80% chance of hitting 2,600, and 2,300 is not a recommended stop. Price could touch either boundary during the horizon and still close inside the interval at the end.
The accompanying chart is a display example, not a trade recommendation or evidence of predictive accuracy. The live candle can move away from the cone's origin because the origin remains fixed at the last confirmed close until the next candle closes.
Historical trace
The optional small boundary dots show the 80% endpoint forecast issued exactly Horizon bars earlier for each target bar. A larger cyan or magenta dot marks a confirmed close outside that original interval. Wick-only excursions do not trigger these markers. These are forecast misses, not entry signals or a strategy backtest.
Method
For every horizon from 1 to H, CPC collects completed log returns and divides each by the volatility estimate known at that historical starting bar. Volatility is the square root of an RMA of squared one-bar log returns. A rolling window of these normalized outcomes is sorted to obtain seven empirical quantiles, then rescaled using the latest confirmed volatility and close. Each horizon is estimated separately; band widths need not increase monotonically.
Despite the indicator's name, this version uses empirical quantiles, not a formal conformal calibration procedure. The 50/80/95 levels are nominal and carry no conformal coverage guarantee. Samples overlap and are dependent. No trading profitability or out-of-sample coverage claim is made.
Timeframes and history
The model uses the active chart's bars and rebuilds when you change timeframe. A 12-bar horizon means 12 minutes on 1m, 3 hours on 15m, 12 hours on 1H, 48 hours on 4H, 12 daily bars on 1D, or 12 weekly bars on 1W. Session breaks can extend elapsed calendar time.
A full calibration window is required at every horizon. With default settings, roughly 342 confirmed bars are needed before the first cone; the historical trace needs a further horizon to mature. The maximum settings need roughly 624 bars. If history is insufficient or prices/volatility are invalid, no cone is drawn. In particular, monthly crypto charts may not have enough history even with the minimum calibration window. This is not a claim of compatibility with every available interval.
Use standard time-based candles and positive-price instruments with sufficient valid history. Synthetic chart types are rejected. Seconds, tick, and range intervals have not been validated for publication.
Confirmed-bar behavior
The model and cone update only when a candle closes. The current unfinished candle does not change the cone. Historical trace values retain the forecasts originally issued at their respective bars. Changing settings, symbol, timeframe, available history, or revised source data can change calculated results. A new cone after each close is a new forecast.
Settings
- Horizon: 6–24 bars.
- Calibration window: 200–500 valid observations per horizon.
- Volatility memory: 10–100 bars.
- Independent visibility for 50/80/95 bands, median, endpoint labels, and historical trace.
- Custom colors and transparency.
If endpoint labels are clipped, leave more empty chart space to the right. If the chart stays compressed after changing timeframe, reset its price scale to Auto.
License
© 2026 builtbyuba. Creative Commons Attribution-NonCommercial-ShareAlike 4.0 International (CC BY-NC-SA 4.0). Attribution, noncommercial use, and the same license for adaptations are required under the license terms. TradingView's applicable publishing and reuse rules also apply.
It is a market-context tool. It does not provide entries, take-profit levels, stop-loss levels, position sizing, or a risk-management system.
Reading the cone
The three nested bands show central empirical intervals at each future bar:
- 50%: the 25th to 75th percentiles.
- 80%: the 10th to 90th percentiles.
- 95%: the 2.5th to 97.5th percentiles.
Cyan shows the area above the pointwise median; magenta shows the area below it. These colors are not buy/sell signals. The dashed line connects the median closing-price estimate at each horizon; it is not the most likely trajectory.
The bands can be asymmetric because positive and negative historical returns are sampled together without imposing a symmetric distribution. A longer lower tail indicates larger downside outcomes in the sample, not automatically a higher probability of falling.
Percentages describe the full lower-to-upper interval. An 80% band does not mean an 80% probability of reaching its upper edge. The bands concern closes at individual horizons, not wick extremes, target-touch probabilities, or containment of the entire future path. Actual future coverage can differ substantially from the labels.
Chart example
On an ETHUSDT 4-hour chart with a 12-bar horizon, the right edge represents 48 hours ahead in this continuously traded market. Read each vertical slice as a separate future-close interval. The endpoint labels are the interval boundaries at bar 12.
For a simple hypothetical example, suppose the 80% endpoint labels are 2,300 and 2,600. Those numbers describe the central historical distribution after volatility scaling. They do not imply an 80% chance of hitting 2,600, and 2,300 is not a recommended stop. Price could touch either boundary during the horizon and still close inside the interval at the end.
The accompanying chart is a display example, not a trade recommendation or evidence of predictive accuracy. The live candle can move away from the cone's origin because the origin remains fixed at the last confirmed close until the next candle closes.
Historical trace
The optional small boundary dots show the 80% endpoint forecast issued exactly Horizon bars earlier for each target bar. A larger cyan or magenta dot marks a confirmed close outside that original interval. Wick-only excursions do not trigger these markers. These are forecast misses, not entry signals or a strategy backtest.
Method
For every horizon from 1 to H, CPC collects completed log returns and divides each by the volatility estimate known at that historical starting bar. Volatility is the square root of an RMA of squared one-bar log returns. A rolling window of these normalized outcomes is sorted to obtain seven empirical quantiles, then rescaled using the latest confirmed volatility and close. Each horizon is estimated separately; band widths need not increase monotonically.
Despite the indicator's name, this version uses empirical quantiles, not a formal conformal calibration procedure. The 50/80/95 levels are nominal and carry no conformal coverage guarantee. Samples overlap and are dependent. No trading profitability or out-of-sample coverage claim is made.
Timeframes and history
The model uses the active chart's bars and rebuilds when you change timeframe. A 12-bar horizon means 12 minutes on 1m, 3 hours on 15m, 12 hours on 1H, 48 hours on 4H, 12 daily bars on 1D, or 12 weekly bars on 1W. Session breaks can extend elapsed calendar time.
A full calibration window is required at every horizon. With default settings, roughly 342 confirmed bars are needed before the first cone; the historical trace needs a further horizon to mature. The maximum settings need roughly 624 bars. If history is insufficient or prices/volatility are invalid, no cone is drawn. In particular, monthly crypto charts may not have enough history even with the minimum calibration window. This is not a claim of compatibility with every available interval.
Use standard time-based candles and positive-price instruments with sufficient valid history. Synthetic chart types are rejected. Seconds, tick, and range intervals have not been validated for publication.
Confirmed-bar behavior
The model and cone update only when a candle closes. The current unfinished candle does not change the cone. Historical trace values retain the forecasts originally issued at their respective bars. Changing settings, symbol, timeframe, available history, or revised source data can change calculated results. A new cone after each close is a new forecast.
Settings
- Horizon: 6–24 bars.
- Calibration window: 200–500 valid observations per horizon.
- Volatility memory: 10–100 bars.
- Independent visibility for 50/80/95 bands, median, endpoint labels, and historical trace.
- Custom colors and transparency.
If endpoint labels are clipped, leave more empty chart space to the right. If the chart stays compressed after changing timeframe, reset its price scale to Auto.
License
© 2026 builtbyuba. Creative Commons Attribution-NonCommercial-ShareAlike 4.0 International (CC BY-NC-SA 4.0). Attribution, noncommercial use, and the same license for adaptations are required under the license terms. TradingView's applicable publishing and reuse rules also apply.

免責事項
これらの情報および投稿は、TradingViewが提供または承認する金融、投資、取引、またはその他の種類の助言もしくは推奨であることを意図したものではなく、またこれらに該当するものでもありません。詳細は利用規約をご覧ください。
免責事項
これらの情報および投稿は、TradingViewが提供または承認する金融、投資、取引、またはその他の種類の助言もしくは推奨であることを意図したものではなく、またこれらに該当するものでもありません。詳細は利用規約をご覧ください。