OPEN-SOURCE SCRIPT
Market Crash Barometer AB
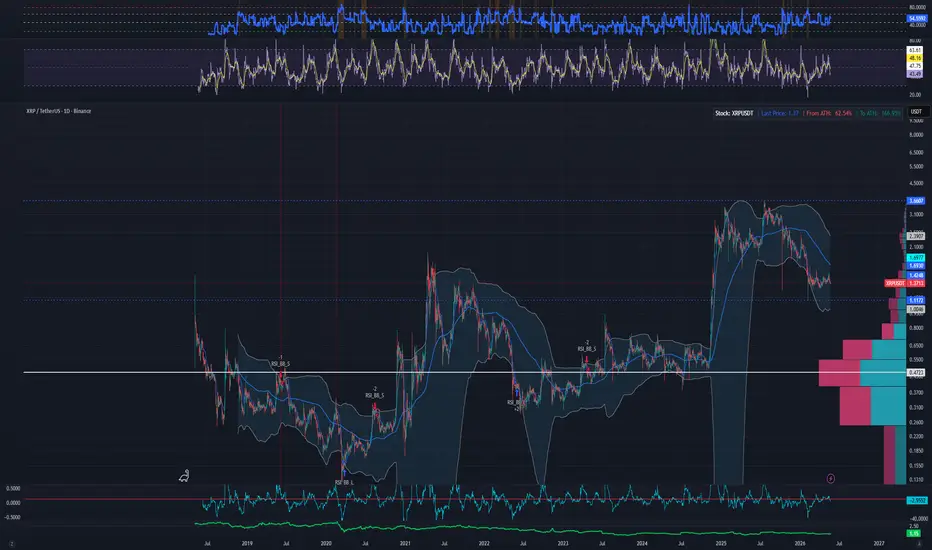
Market Crash Barometer by AB
The Market Crash Barometer is a multi-factor risk indicator designed to measure overall market stress and identify conditions that commonly appear before sharp market selloffs or panic events.
Instead of relying on a single signal, this indicator combines six key market factors into one unified Crash Score (0–100):
The combined score creates a real-time stress gauge that helps traders quickly assess whether markets are calm, weakening, or entering panic conditions.
Crash Score Zones
Background colors automatically highlight extreme risk environments:
Notes
This indicator is not intended to predict exact market tops or crashes. Instead, it acts as a probabilistic warning system by combining volatility, momentum, trend, and participation metrics into a single easy-to-read framework.
Works best when combined with price action and broader market analysis.
The Market Crash Barometer is a multi-factor risk indicator designed to measure overall market stress and identify conditions that commonly appear before sharp market selloffs or panic events.
Instead of relying on a single signal, this indicator combines six key market factors into one unified Crash Score (0–100):
- VIX Fear Index – Measures volatility and market fear
- Trend Strength – Detects when price trades below the 200-period moving average
- RSI Weakness – Identifies deteriorating momentum
- MACD Momentum – Confirms bearish momentum shifts
- Volume Expansion – Highlights abnormal trading activity
- ATR Volatility – Tracks rising market instability
The combined score creates a real-time stress gauge that helps traders quickly assess whether markets are calm, weakening, or entering panic conditions.
Crash Score Zones
- 0–25 → Normal Conditions
- 25–45 → Caution
- 45–65 → Stress
- 65–80 → Panic
- 80+ → Elevated Crash Risk
Background colors automatically highlight extreme risk environments:
- Orange = Panic conditions
- Red = Severe crash risk
- Best Uses
- Risk management
- Market regime detection
- Confirming bearish setups
- Identifying high-volatility environments
- Timing defensive positioning
Pine Script® Pine Script® Pine Script®
Notes
This indicator is not intended to predict exact market tops or crashes. Instead, it acts as a probabilistic warning system by combining volatility, momentum, trend, and participation metrics into a single easy-to-read framework.
Works best when combined with price action and broader market analysis.
オープンソーススクリプト
TradingViewの精神に則り、このスクリプトの作者はコードをオープンソースとして公開してくれました。トレーダーが内容を確認・検証できるようにという配慮です。作者に拍手を送りましょう!無料で利用できますが、コードの再公開はハウスルールに従う必要があります。

免責事項
これらの情報および投稿は、TradingViewが提供または承認する金融、投資、取引、またはその他の種類の助言もしくは推奨であることを意図したものではなく、またこれらに該当するものでもありません。詳細は利用規約をご覧ください。
オープンソーススクリプト
TradingViewの精神に則り、このスクリプトの作者はコードをオープンソースとして公開してくれました。トレーダーが内容を確認・検証できるようにという配慮です。作者に拍手を送りましょう!無料で利用できますが、コードの再公開はハウスルールに従う必要があります。
免責事項
これらの情報および投稿は、TradingViewが提供または承認する金融、投資、取引、またはその他の種類の助言もしくは推奨であることを意図したものではなく、またこれらに該当するものでもありません。詳細は利用規約をご覧ください。