WiseWealth ; Ichimoku Trend-Scoring
### **Ichimoku Multi-Pillar Trend Scoring Engine ("Ichi Score")**
#### **1. Introduction**
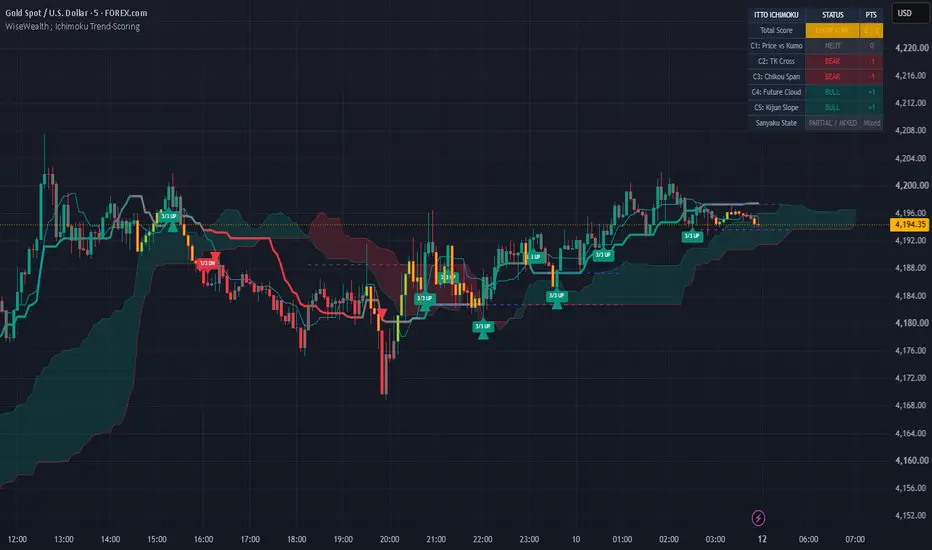
The **Ichimoku Multi-Pillar Trend Scoring Engine**, colloquially known as **"Ichi Score,"** is an advanced chart overlay indicator developed in Pine Script version 6 for modern technical analysis platforms. The primary objective of this script is to revolutionize the traditional Ichimoku Kinko Hyo framework by converting its complex, multi-lined charting environment into an automated **Trend Scoring Engine**. Traditional Ichimoku charts display multiple overlapping lines that often create visual clutter and confuse traders. The Ichi Score resolves this core challenge by evaluating market conditions across five distinct technical dimensions and consolidating them into a single, quantifiable **Composite Net Score ranging from -5 to +5**. This automated numerical synthesis enables traders to filter out misleading false breakouts during market consolidation (**Chop Zones**) and confidently isolate genuine bullish or bearish trends. Furthermore, an intuitive on-screen **Heads-Up Display (HUD) Dashboard** presents real-time trend analytics, streamlining executive trading decisions directly on the chart.
---
#### **2. Technical Working Mechanism**
The core underlying engine calculates **Donchian Midpoints**—averaging the highest high and lowest low over customized historical lookback windows—to project foundational Ichimoku components, including the Tenkan-sen, Kijun-sen, and Kumo Cloud boundaries. Trade signal detection operates through five quantitative scoring pillars, where each pillar evaluates specific price dynamics and assigns a sub-score of **+1** (Bullish), **-1** (Bearish), or **0** (Neutral):
* **C1: Price vs. Current Kumo**: Evaluates candlestick position relative to current cloud parameters. A candle closing above the cloud ceiling (Kumo Max) receives **+1**, whereas a close below the cloud floor (Kumo Min) receives **-1**.
* **C2: TK Cross / Position**: Measures short- to medium-term momentum alignment. When the conversion line (Tenkan-sen) sits above the base line (Kijun-sen), a **+1** score is awarded; a position below assigns **-1**.
* **C3: Chikou Span**: Compares the current closing price against historical price action displaced backward. Closing above past historical highs awards **+1**, while falling below historical lows assigns **-1**, confirming breakout momentum.
* **C4: Future Kumo Bias**: Detects long-term macro trend direction by assessing displaced future cloud boundaries. Senkou Span A positioned above Senkou Span B (Green Kumo) scores **+1**, while Span A below Span B (Red Kumo) scores **-1**.
* **C5: Kijun Slope**: Analyzes the structural trajectory of the Kijun-sen base line. An upward slope adds **+1**, a downward slope subtracts **-1**, and a flat horizontal trajectory yields **0**.
When aggregated into a total composite score, reaching the **Strong Threshold** (defaulted at **±4**) prompts the script to plot prominent **"Strong Up"** or **"Strong Down"** triangular execution markers on the price candles. Additionally, the system checks for **Sanyaku 3/3 Alignment**—requiring simultaneous confluence of price above cloud, TK crossover, and Chikou span breakout—and displays confirmation labels marking maximum trend strength. Conversely, when the composite score hovers near zero within the Chop Score Band, or when price fluctuates inside the Kumo cloud, the system identifies a **Chop Zone**. In this state, candle colors automatically shift to amber or grey, and trade entry signals are completely suppressed to protect capital. To ensure reliability, signals execute strictly on **Confirmed Bars** (completed closes), eliminating repainting issues. Furthermore, prolonged flat periods on the Kijun-sen or Senkou Span B automatically generate horizontal dashed **Equilibrium Magnets** on the chart, serving as static support and resistance benchmarks.
---
#### **3. Practical Application & Preset Configurations**
To maximize operational efficiency across diverse financial instruments, traders can select specialized preset profiles tailored to specific market dynamics:
* **Classic (9/26/52/26)**: Employs traditional Ichimoku period settings, optimized for standard capital asset classes and higher timeframe swing trading.
* **5-Day Week (7/22/44/22)**: Specifically adjusted for institutional 5-day trading calendars, making it ideal for Stock markets, ETFs, Indices, and Forex on daily chart timeframes.
* **Crypto (20/60/120/30)**: Features extended lookback parameters specifically structured for 24/7 cryptocurrency trading, effectively smoothing high volatility and removing market noise.
* **Custom**: Allows quantitative traders and short-term scalpers to freely customize individual period lengths and scoring thresholds.
In live execution, traders should consult the on-screen **HUD Dashboard** prior to entering any trade. If the status reads **"CHOP ZONE"** alongside amber or grey candles, a **No-Action** stance is required to conserve equity. Position entries should only be triggered when the HUD transitions to **"STRONG UP"** or **"STRONG DOWN"** accompanied by green or dark red candles, triangle entry markers, or **3/3 Alignment** badges. Once a trade is active, the auto-generated cyan Kijun and purple Span B **Equilibrium Magnets** act as statistically backed references for placing **Take Profit** targets and **Stop Loss** levels. Finally, the indicator integrates real-time alerts to notify traders immediately upon major trend reversals.
#### **1. Introduction**
The **Ichimoku Multi-Pillar Trend Scoring Engine**, colloquially known as **"Ichi Score,"** is an advanced chart overlay indicator developed in Pine Script version 6 for modern technical analysis platforms. The primary objective of this script is to revolutionize the traditional Ichimoku Kinko Hyo framework by converting its complex, multi-lined charting environment into an automated **Trend Scoring Engine**. Traditional Ichimoku charts display multiple overlapping lines that often create visual clutter and confuse traders. The Ichi Score resolves this core challenge by evaluating market conditions across five distinct technical dimensions and consolidating them into a single, quantifiable **Composite Net Score ranging from -5 to +5**. This automated numerical synthesis enables traders to filter out misleading false breakouts during market consolidation (**Chop Zones**) and confidently isolate genuine bullish or bearish trends. Furthermore, an intuitive on-screen **Heads-Up Display (HUD) Dashboard** presents real-time trend analytics, streamlining executive trading decisions directly on the chart.
---
#### **2. Technical Working Mechanism**
The core underlying engine calculates **Donchian Midpoints**—averaging the highest high and lowest low over customized historical lookback windows—to project foundational Ichimoku components, including the Tenkan-sen, Kijun-sen, and Kumo Cloud boundaries. Trade signal detection operates through five quantitative scoring pillars, where each pillar evaluates specific price dynamics and assigns a sub-score of **+1** (Bullish), **-1** (Bearish), or **0** (Neutral):
* **C1: Price vs. Current Kumo**: Evaluates candlestick position relative to current cloud parameters. A candle closing above the cloud ceiling (Kumo Max) receives **+1**, whereas a close below the cloud floor (Kumo Min) receives **-1**.
* **C2: TK Cross / Position**: Measures short- to medium-term momentum alignment. When the conversion line (Tenkan-sen) sits above the base line (Kijun-sen), a **+1** score is awarded; a position below assigns **-1**.
* **C3: Chikou Span**: Compares the current closing price against historical price action displaced backward. Closing above past historical highs awards **+1**, while falling below historical lows assigns **-1**, confirming breakout momentum.
* **C4: Future Kumo Bias**: Detects long-term macro trend direction by assessing displaced future cloud boundaries. Senkou Span A positioned above Senkou Span B (Green Kumo) scores **+1**, while Span A below Span B (Red Kumo) scores **-1**.
* **C5: Kijun Slope**: Analyzes the structural trajectory of the Kijun-sen base line. An upward slope adds **+1**, a downward slope subtracts **-1**, and a flat horizontal trajectory yields **0**.
When aggregated into a total composite score, reaching the **Strong Threshold** (defaulted at **±4**) prompts the script to plot prominent **"Strong Up"** or **"Strong Down"** triangular execution markers on the price candles. Additionally, the system checks for **Sanyaku 3/3 Alignment**—requiring simultaneous confluence of price above cloud, TK crossover, and Chikou span breakout—and displays confirmation labels marking maximum trend strength. Conversely, when the composite score hovers near zero within the Chop Score Band, or when price fluctuates inside the Kumo cloud, the system identifies a **Chop Zone**. In this state, candle colors automatically shift to amber or grey, and trade entry signals are completely suppressed to protect capital. To ensure reliability, signals execute strictly on **Confirmed Bars** (completed closes), eliminating repainting issues. Furthermore, prolonged flat periods on the Kijun-sen or Senkou Span B automatically generate horizontal dashed **Equilibrium Magnets** on the chart, serving as static support and resistance benchmarks.
---
#### **3. Practical Application & Preset Configurations**
To maximize operational efficiency across diverse financial instruments, traders can select specialized preset profiles tailored to specific market dynamics:
* **Classic (9/26/52/26)**: Employs traditional Ichimoku period settings, optimized for standard capital asset classes and higher timeframe swing trading.
* **5-Day Week (7/22/44/22)**: Specifically adjusted for institutional 5-day trading calendars, making it ideal for Stock markets, ETFs, Indices, and Forex on daily chart timeframes.
* **Crypto (20/60/120/30)**: Features extended lookback parameters specifically structured for 24/7 cryptocurrency trading, effectively smoothing high volatility and removing market noise.
* **Custom**: Allows quantitative traders and short-term scalpers to freely customize individual period lengths and scoring thresholds.
In live execution, traders should consult the on-screen **HUD Dashboard** prior to entering any trade. If the status reads **"CHOP ZONE"** alongside amber or grey candles, a **No-Action** stance is required to conserve equity. Position entries should only be triggered when the HUD transitions to **"STRONG UP"** or **"STRONG DOWN"** accompanied by green or dark red candles, triangle entry markers, or **3/3 Alignment** badges. Once a trade is active, the auto-generated cyan Kijun and purple Span B **Equilibrium Magnets** act as statistically backed references for placing **Take Profit** targets and **Stop Loss** levels. Finally, the indicator integrates real-time alerts to notify traders immediately upon major trend reversals.

免責事項
これらの情報および投稿は、TradingViewが提供または承認する金融、投資、取引、またはその他の種類の助言もしくは推奨であることを意図したものではなく、またこれらに該当するものでもありません。詳細は利用規約をご覧ください。
免責事項
これらの情報および投稿は、TradingViewが提供または承認する金融、投資、取引、またはその他の種類の助言もしくは推奨であることを意図したものではなく、またこれらに該当するものでもありません。詳細は利用規約をご覧ください。