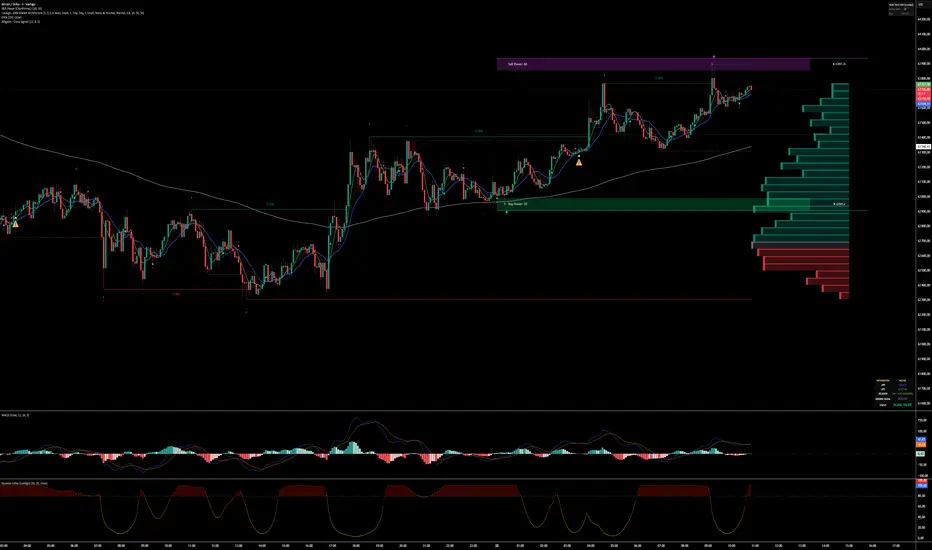
Bystry Counter Strike Style + PVSRABystry Counter Strike Style + PVSRA
This indicator is a breakout and trade-management tool designed to help traders visualize potential long and short strike zones, dynamic profit targets, stop levels, and volume-based candle context directly on the chart.
The script combines four main components:
1. Dynamic Strike Channel
The indicator builds a dynamic price channel using recent market structure. The upper boundary represents a potential long breakout area, while the lower boundary represents a potential short breakout area.
The channel is calculated from recent highs and lows over a configurable lookback window. This makes the tool adapt to changing market conditions instead of using fixed horizontal levels.
2. Breakout Signals
Long signals are generated when price breaks above the upper strike level, while short signals are generated when price breaks below the lower strike level.
The user can choose between:
* Confirmed Close mode: signals are based on candle close confirmation.
* Intrabar Wick Touch mode: signals can appear when price touches the level during the candle.
Confirmed Close mode is designed to reduce intrabar signal changes and is the default approach for cleaner confirmation.
3. Dynamic TP and SL Logic
The indicator automatically calculates potential TP1 and stop-loss levels using ATR and the width of the strike channel.
This allows the risk and target zones to expand or contract depending on current volatility.
The script includes:
* Future Long TP1
* Future Long SL
* Future Short TP1
* Future Short SL
* Active trade lines
* Optional fixed or trailing stop behavior
The stop mode can be set to:
* Auto
* Fixed
* Trailing
In Auto mode, the script can switch to trailing behavior depending on market volatility conditions.
4. PVSRA Candle Coloring
This version includes PVSRA-style candle coloring to highlight unusual volume behavior.
The candle coloring uses:
* Average volume
* Candle spread
* Volume multiplied by spread
* Climax volume conditions
* Rising volume conditions
The purpose of this layer is to help traders see when a breakout or rejection happens with increased volume activity.
Default PVSRA candle logic:
* Bullish climax candles are highlighted when bullish candles appear with strong volume or strong volume-spread behavior.
* Bearish climax candles are highlighted when bearish candles appear with strong volume or strong volume-spread behavior.
* Rising volume candles are marked separately to show increased participation before or during a move.
Main Features
* Dynamic long breakout level
* Dynamic short breakout level
* Adaptive strike channel
* ATR-based TP and SL levels
* Optional EMA trend filter
* Optional volatility filter
* Fixed or trailing stop logic
* PVSRA candle coloring
* Entry labels
* TP1 labels
* Stop and trailing exit labels
* Performance table
* Alert conditions for entries, TP1, stop events, trailing conversion, and channel changes
* Dynamic alert messages using alert()
How To Use
This tool is intended to be used as a visual decision-support indicator, not as a standalone automated trading system.
A basic workflow may look like this:
1. Use the EMA filter to define directional bias.
* Price above EMA may favor long setups.
* Price below EMA may favor short setups.
2. Watch the dynamic strike channel.
* A break above the upper level may suggest bullish continuation.
* A break below the lower level may suggest bearish continuation.
3. Use PVSRA candle colors as additional context.
* Strong volume on a breakout can indicate participation.
* Strong opposite volume near a level may suggest rejection or absorption.
4. Use TP1 and SL levels as reference zones.
* These levels are calculated dynamically from ATR and channel width.
* They are not guaranteed execution prices.
5. Combine the indicator with your own market structure analysis.
* Higher timeframe trend
* Support and resistance
* Liquidity zones
* Session timing
* Risk management
Inputs
Counter Strike Engine:
* AI Direction: choose Long & Short, Trade Longs, or Trade Shorts.
* Signal Mode: choose Full System or Entries Only.
* Learning / Strike Window: controls the lookback period for the strike channel.
* ATR Length: controls volatility calculation.
* Minimum ATR Profit Target: sets the minimum target distance.
* Minimum ATR Stop Loss: sets the minimum stop distance.
* Auto ATR Adjustment On Very Low Timeframes: increases ATR distance on very low timeframes.
* Entry Buffer ATR: adds a small ATR-based buffer to breakout levels.
* Stop Loss Mode: Auto, Trailing, or Fixed.
* Same Candle TP/SL Assumption: controls how the script handles candles where both TP and SL are touched.
* Entry Trigger: Confirmed Close or Intrabar Wick Touch.
Filters:
* EMA Filter: optional trend filter.
* EMA Filter Length: default trend filter length.
* Volatility Filter: optional filter for market volatility conditions.
Visuals:
* Show Strike Channel
* Show EMA
* Show Future TP/SL
* Show Trade Buttons
* Show Performance Table
* Label Size
* Brighter Labels
* Table Location
PVSRA Candle Coloring:
* Enable PVSRA Candle Coloring
* PVSRA Volume MA Length
* Climax Volume Multiplier
* Rising Volume Multiplier
* Custom candle colors for bullish and bearish volume conditions
Alerts
The script includes alert conditions for:
* Long Entry
* Short Entry
* TP1 Hit
* Trailing Stop Conversion
* Stop or Trail Exit
* Long Entry Price Changed
* Short Entry Price Changed
* Any Important Event
It also includes optional dynamic alert() messages with symbol, timeframe, entry price, TP1, and SL information.
Important Notes
This indicator does not use future data or lookahead logic.
The performance table is a simplified internal visual reference and should not be treated as an official strategy backtest. For full backtesting, commission modeling, slippage modeling, and order execution simulation, a dedicated strategy version should be used.
Signals may behave differently depending on the selected trigger mode. Confirmed Close mode is generally cleaner for historical review, while Intrabar Wick Touch mode can react earlier but may change during the live candle.
This tool is not financial advice. It does not predict the future and does not guarantee profitable results. It should be used together with proper risk management and independent market analysis.
Recommended Markets and Timeframes
The indicator can be tested on forex, crypto, indices, commodities, and futures markets.
For cleaner signals, higher intraday timeframes such as 15m, 30m, and 1h are generally more stable than very low timeframes. Very low timeframes may produce more noise and should be used with additional confirmation.
Originality
This script is an original breakout and trade-management tool that combines a dynamic strike channel, ATR-based target and stop logic, optional trend and volatility filters, alert support, and PVSRA-style candle coloring in one chart-based workflow.
It is not intended to reproduce or copy any closed-source script. The calculations, trade-management logic, and visual structure are implemented independently.
インジケーター

Bystry Prime-Style Oscillator ProBystry Prime-Style Oscillator Pro is a multi-layer momentum, money-flow and volume oscillator designed to help traders read market pressure, exhaustion zones and potential momentum shifts in a clean oscillator panel.
This indicator is an original Pine Script v6 tool. It is not affiliated with, endorsed by, or intended to reproduce any proprietary or closed-source indicator. The goal of this script is to provide a transparent, self-contained oscillator framework that combines momentum, volume pressure, money flow and trend confirmation into one visual dashboard.
What the indicator does:
The script builds a normalized oscillator using several market components:
1. Price momentum
The indicator measures price impulse and deviation from a smoothed trend baseline. This helps identify whether price is expanding away from its average behavior or returning toward balance.
2. Momentum confirmation
RSI, CCI and MFI-style components are normalized and blended into the main oscillator. This allows the tool to react not only to price movement, but also to changes in internal momentum.
3. Money Flow Tracker
The money-flow module estimates buying and selling pressure by combining candle body pressure, close location inside the candle range and volume. This helps identify whether volume is supporting bullish or bearish movement.
4. Volume Matrix
The volume matrix compares bullish and bearish volume participation. It is designed to show whether the current move has meaningful volume support or whether price is moving with weak participation.
5. True 7 Rank System
The True 7 model scores market conditions using seven bullish and seven bearish checks, including oscillator direction, signal-line relationship, money flow, volume pressure and trend alignment. The result is displayed as a simple strength framework that helps traders avoid relying on one signal alone.
6. Dynamic Bands
The oscillator includes adaptive upper and lower bands based on recent oscillator behavior. These bands help identify overbought, oversold and extreme conditions without relying only on fixed levels.
7. Peak Seekers and Divergences
Confirmed oscillator pivots can mark potential exhaustion areas. The script can also highlight bullish and bearish divergence when price makes a new extreme while the oscillator fails to confirm that move.
How to read the indicator:
Bullish conditions are generally stronger when:
* the oscillator is above its signal line,
* the oscillator is above the zero line,
* money flow is positive,
* the volume matrix supports buyers,
* the True 7 bullish score is high.
Bearish conditions are generally stronger when:
* the oscillator is below its signal line,
* the oscillator is below the zero line,
* money flow is negative,
* the volume matrix supports sellers,
* the True 7 bearish score is high.
The overbought and oversold zones should not be used as automatic buy or sell signals. Strong trends can remain overbought or oversold for long periods. These zones are most useful when combined with momentum shifts, money-flow changes, divergence or market-structure confirmation.
Signals and alerts:
The indicator includes alert conditions for:
* bullish reversal signal,
* bearish reversal signal,
* bullish momentum shift,
* bearish momentum shift,
* bullish peak seeker,
* bearish peak seeker,
* bullish divergence,
* bearish divergence.
For cleaner alerts, it is recommended to use “Once Per Bar Close” when creating TradingView alerts.
Important behavior:
Peak seeker and divergence markers are confirmed only after the required right-side pivot bars have closed. For visual clarity, these markers are plotted on the original pivot candle, but they are not known in real time until confirmation. This avoids misleading users about when the signal becomes available.
The indicator does not guarantee future performance and should not be used as a standalone trading system. It is designed as a decision-support tool and should be combined with market structure, risk management, session context and higher-timeframe analysis.
Suggested use:
This oscillator can be useful for:
* identifying momentum expansion and exhaustion,
* confirming trend continuation,
* filtering weak signals with volume and money flow,
* spotting divergence near important zones,
* building confluence with support/resistance, liquidity zones or session-based strategies.
Risk disclaimer:
This script is for educational and analytical purposes only. It does not provide financial advice. No indicator can predict market movement with certainty. Past signals or historical behavior do not guarantee future results. Always use proper risk management and test the indicator on your own markets and timeframes before using it in live trading.
インジケーター

インジケーター

インジケーター

インジケーター
インジケーター

インジケーター
ストラテジー

インジケーター
MAX CYCLE RADAR v3.6.1 RU PRO FIXEDГлавный вывод:
Это уже не просто “стрелочник купить/продать”. Это **комбайн-радар рыночного цикла**, который пытается понять: рынок копит, сжимается, снимает ликвидность, даёт импульс, входит в тренд или уже тухнет.
Главная задача индикатора — не угадывать дно, а дать нормальный вход **после подтверждения**, со стопом, тейками и пониманием, не поздно ли лезть.
Что это за индикатор
Название: MAX CYCLE RADAR v3.6.1 RU PRO FIXED
Тип: индикатор TradingView на Pine Script v6, не стратегия.
То есть он:
* показывает сигналы ПОКУПАТЬ / ПРОДАВАТЬ;
* рисует вход, стоп, тейки;
* показывает состояние рынка в инфо-окне;
* учитывает старшие таймфреймы;
* определяет фазу рынка;
* пытается не лезть в поздний вход после пампа.
Но он не открывает сделки сам и не тестируется как полноценная стратегия в Strategy Tester. Для тестера позже надо делать отдельную версию `strategy()`.
Главная идея
Мы не ушли от основной логики:
**накопление → сжатие → вынос ликвидности → импульс → откат / ретест → вход → тренд → затухание / боковик**
Индикатор пытается не просто увидеть зелёную свечу, а понять, где мы внутри этого цикла.
Что встроено внутрь
1. Squeeze / Momentum
Это модуль раннего предупреждения.
Он ищет:
* сжатие волатильности;
* выход из сжатия;
* пробуждение импульса;
* смену momentum.
Задача: заранее подсказать, что рынок может скоро рвануть.
Но сам по себе squeeze — не вход. Это как сигнал:
“готовься, скоро будет движение”.
---
2. Directional Flux
Это модуль силы направления.
Он смотрит, есть ли реальное ускорение цены относительно ATR.
Простыми словами:
* Flux вверх → покупатели начинают давить;
* Flux вниз → продавцы давят;
* Flux слабый → рынок шумит, сигналы хуже.
---
3. Liquidity Sweep
Это важный блок.
Он ищет ситуации, где рынок:
* пробил предыдущий high и вернулся обратно;
* пробил предыдущий low и вернулся обратно;
* сделал ложный пробой диапазона.
То есть он пытается поймать момент:
**толпу вынесли по стопам, а цена вернулась обратно.**
Это нужно для логики:
* сняли низ → возможен лонг;
* сняли верх → возможен шорт.
---
4. BOS / CHoCH
Это структурный блок из идеи Meridian Flow.
Он определяет:
BOS — пробой структуры по тренду.
CHoCH— смена характера движения, возможный разворот.
Простыми словами:
* BOS вверх → тренд вверх подтверждается;
* BOS вниз → тренд вниз подтверждается;
* CHoCH вверх → медвежий рынок может разворачиваться вверх;
* CHoCH вниз → бычий рынок может ломаться вниз.
Важно: этот блок не самый ранний, потому что работает через swing/pivot. Он подтверждает структуру с задержкой, зато меньше фантазирует.
---
5. Order Block
Индикатор берёт последнюю значимую свечную зону перед пробоем.
Для лонга:
* после BOS/CHoCH вверх берётся последняя медвежья зона;
* если цена возвращается туда и удерживается — это может быть зона входа.
Для шорта:
* после BOS/CHoCH вниз берётся последняя бычья зона;
* возврат туда может быть зоной шорта.
На графике мы не рисуем десятки OB, а только последнюю важную зону, чтобы не засрать экран.
---
6. Fibonacci Structure
Это модуль из Fibonacci Structure Engine.
Он ищет:
* последний импульс;
* fib-зону отката;
* цели по расширению.
Главная логика:
Для лонга лучше покупать не на хаях, а когда цена вернулась в нормальную зону:
0.5–0.786
Для шорта аналогично — не шортить низ, а ждать откат выше.
Это защищает от тупого входа после свечи в космос.
---
7. Trend Quality Index / TQI
Это идея из Self-Aware Trend System.
Индикатор оценивает качество тренда по нескольким факторам:
* эффективность движения;
* ADX;
* устойчивость momentum;
* состояние волатильности.
В инфо-окне это строка:
Тренд: сильный / средний / слабый
Смысл простой:
* сильный тренд → можно держать дальше;
* средний → осторожно;
* слабый → не добирать, готовиться к выходу.
---
8. Adaptive Trail
Это умная тренд-линия.
Она работает как динамическая защита позиции.
Если рынок шумный — линия шире.
Если тренд сильный — линия подтягивается лучше.
По ней индикатор может понять:
* держать позицию;
* выходить;
* тренд сломался;
* вход уже поздний.
---
9. MTF-фильтр
Индикатор смотрит несколько таймфреймов:
* 15m
* 1h
* 4h
* 1D
В инфо-окне строка **ТФ** показывает:
* Б = бычьи таймфреймы;
* М = медвежьи;
* Н = нейтральные.
Например:
Б3 / М1 / Н0
Это значит: 3 таймфрейма за рост, 1 против.
---
10. Новости вручную
TradingView не даёт нормально подключить реальные политические новости и календарь прямо внутрь Pine Script. Поэтому сделан ручной блок.
Можно включить:
* Новость 1;
* Новость 2;
* Новость 3;
* политический риск вручную.
Индикатор может:
* блокировать вход перед новостью;
* показать “СКОРО НОВОСТЬ”;
* после новости учитывать импульс вверх или вниз.
Это не автоматический новостной ИИ. Это ручной предохранитель.
## Что показывает на графике
На графике должно быть минимально:
ПОКУПАТЬ — когда условия за лонг набрали достаточно баллов.
ПРОДАВАТЬ — когда условия за шорт набрали достаточно баллов.
ВХОД — цена входа.
СТОП — примерный стоп.
ТЕЙК 1 / 2 / 3** — цели.
Фоновая зона** — текущий цикл рынка.
Fib-зона / OB-зона** — если включены.
Мы специально убрали кучу надписей типа `SCOUT`, `LATE`, `PRE`, чтобы график не превращался в помойку.
Что в инфо-окне самое важное
Оставляем только полезное:
Действие
Главное поле. Что делать сейчас:
* ПОКУПАТЬ
* ПРОДАВАТЬ
* ДЕРЖАТЬ ЛОНГ
* ДЕРЖАТЬ ШОРТ
* ЖДИ FIB-ОТКАТ
* ПОЗДНО ЛОНГ
* ПОЗДНО ШОРТ
* НЕ ЛЕЗТЬ
**Цикл**
Где рынок сейчас:
* НАКОПЛЕНИЕ
* СЖАТИЕ
* ВЫНОС СНИЗУ
* ВЫНОС СВЕРХУ
* ИМПУЛЬС ВВЕРХ
* ИМПУЛЬС ВНИЗ
* ТРЕНД ВВЕРХ
* ТРЕНД ВНИЗ
* ЗАТУХАНИЕ
* БОКОВИК
**Структура**
Показывает:
* BOS ↑
* BOS ↓
* CHoCH ↑
* CHoCH ↓
* БЫЧЬЯ
* МЕДВЕЖЬЯ
* НЕТ
**Зона**
Показывает:
* FIB ЛОНГ
* FIB ШОРТ
* OB ЛОНГ
* OB ШОРТ
* В FIB ЗОНЕ
* ПРЕМИУМ / ПОЗДНО
* ДИСКАУНТ / ПОЗДНО
**Тренд**
Сила тренда в процентах.
**Готовность**
Например:
**ЛОНГ 72% / ШОРТ 18%**
Это не вероятность на 100%, а оценка совпадения условий.
**ТФ**
Согласие старших таймфреймов.
**Объём**
OK / средний / слабый.
**Новости**
OFF / скоро новость / политический риск / новость вверх / новость вниз.
**Цели**
Потенциал до TP1 / TP2 / TP3 в процентах.
## Как читать сигналы
### “ПОКУПАТЬ”
Это появляется, когда совпали несколько условий:
* тренд или разворот в сторону лонга;
* MTF не против;
* есть momentum;
* есть структура / ретест / OB / Fib / пробой;
* нет признака “поздно”;
* нет блокировки новостей.
### “ПРОДАВАТЬ”
То же самое, но в обратную сторону.
### “ЖДИ FIB-ОТКАТ”
Это важная команда.
Она означает:
**движение уже пошло, но сейчас покупать поздно. Лучше ждать откат в нормальную зону.**
Вот это как раз защита от ситуации, когда ты покупаешь зелёную свечу на самом верху.
### “ПОЗДНО ЛОНГ”
Это значит:
тренд вверх есть, но цена уже слишком далеко от нормальной зоны. Вход плохой.
### “ЛОНГ СЛАБЕЕТ”
Это не обязательно “сразу продавай”.
Это предупреждение:
**тренд теряет качество, подтягивай стоп, не добирай.**
## На каких таймфреймах использовать
Для BTC:
* Основной вход: **15m / 30m**
* Подтверждение: **1h / 4h**
* Контекст: **1D**
Для ETH:
* Основной вход: **15m / 30m**
* Подтверждение: **1h / 4h**
Для альтов:
* Лучше не ниже **15m**
* И обязательно смотреть **1h / 4h**
* На 5m альты будут давать много шума.
Для скальпа:
* 5m можно, но только если рынок активный;
* входы чаще, но ложных будет больше.
## Какие настройки ставить
Для BTC:
**Профиль:** BTC
**Режим входа:** ГИБРИД
**Визуал:** НОРМАЛЬНО
Для ETH:
**Профиль:** ETH
**Режим входа:** ГИБРИД
Для альтов:
**Профиль:** ALT
**Режим входа:** БЕЗОПАСНЫЙ
Для агрессивной ловли ранних движений:
**Режим входа:** АГРЕССИВНЫЙ
Но там будет больше мусора.
## Важный честный момент
Этот индикатор не будет покупать самое дно.
И это правильно.
Если он начнёт покупать каждую нижнюю свечу, он будет ловить ножи.
Наша система должна работать так:
1. Сначала предупреждение: возможно разворот / вынос / сжатие.
2. Потом подтверждение структуры.
3. Потом вход на откате / ретесте / пробое.
4. Потом стоп и тейки.
То есть он не должен быть “угадайкой”. Он должен быть **радаром риска**.
## Что ещё надо будет доделать
Следующий нормальный шаг — сделать **отдельную strategy-версию**.
Она нужна, чтобы проверить:
* сколько сигналов было;
* win rate;
* средний R;
* просадку;
* какие настройки лучше для BTC;
* какие для ETH;
* какие для альтов.
Сейчас у нас индикатор. Он показывает логику.
Но чтобы понять, зарабатывает он или красиво рисует, нужна версия:
`strategy("MAX CYCLE RADAR STRATEGY")`
Вот там уже можно будет реально прогнать историю.
## Итог
Это индикатор не для тупого “зелёное — покупай”.
Это система, которая собирает несколько слоёв:
**цикл рынка + ликвидность + структура + Fib-зона + качество тренда + MTF + объём + риск новостей**
И финально выдаёт:
**ПОКУПАТЬ / ПРОДАВАТЬ / ДЕРЖАТЬ / ЖДАТЬ / ПОЗДНО / НЕ ЛЕЗТЬ**
Главное: не надо ожидать от него грааль. Его сила не в том, что он угадывает каждое движение, а в том, что он должен отсекать тупые входы и давать более чистые точки после подтверждения.
インジケーター

NASDAQ Z-Score x5 FAST# NASDAQ Z-Score x5 FAST
## Overview
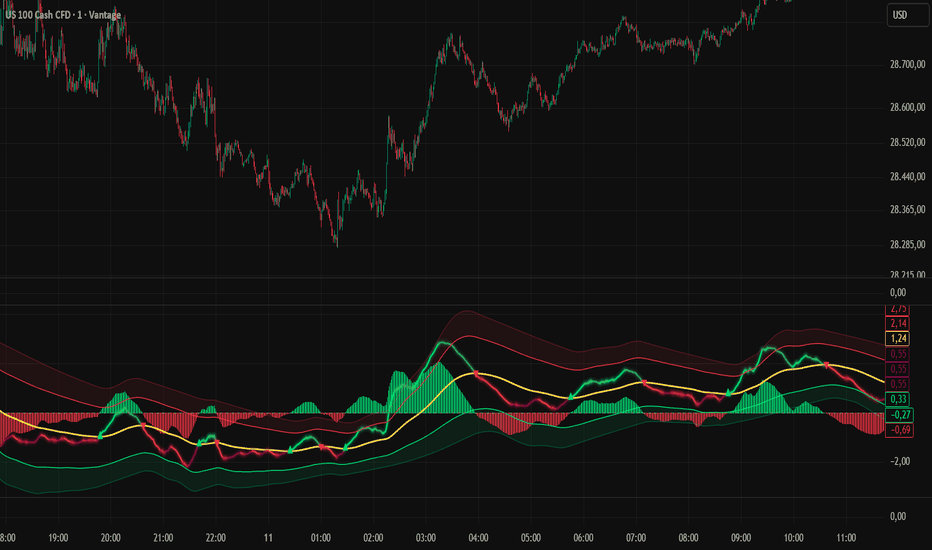
NASDAQ Z-Score x5 FAST is the intermediate trend layer of the NASDAQ Z-Score Framework.
While the standard Chart Version focuses on execution and short-term momentum shifts, the x5 version was specifically designed to reveal the underlying intraday trend structure by filtering out lower timeframe noise.
The indicator uses the same adaptive Z-Score methodology as the Chart Version but operates on a significantly slower and more stable structure.
The result is a cleaner view of trend direction, trend strength, and market pressure without the constant fluctuations that occur on lower timeframes.
---
# Why This Version Was Created
During development it became clear that even a highly optimized chart timeframe oscillator can still react to short-term pullbacks and temporary market noise.
For active NASDAQ traders this creates a common problem:
The chart timeframe may signal a reversal while the underlying trend remains completely intact.
To solve this issue, the x5 version was developed as a dedicated trend confirmation layer.
Instead of focusing on entries, it focuses on identifying the dominant intraday flow and filtering out lower timeframe fluctuations.
The objective is simple:
Trade with the trend, not against it.
---
# Advantages Compared to the Chart Version
## Reduced Market Noise
The x5 version uses a significantly slower structure than the chart timeframe version.
Benefits:
* Fewer false reversals
* Cleaner trend visualization
* Improved directional clarity
* Better trend filtering
---
## Trend Confirmation Layer
The x5 version was specifically designed to answer one question:
"Is the current move supported by the underlying trend?"
Benefits:
* Improved trade selection
* Better directional confidence
* Higher quality setups
* Reduced counter-trend trading
---
## Stronger Market Context
While the chart timeframe focuses on execution, the x5 version focuses on context.
Benefits:
* Better understanding of market structure
* Easier identification of trend phases
* Improved pullback analysis
* Enhanced momentum confirmation
---
## Adaptive Dynamic Zero Line
Like the Chart Version, the x5 version uses a Dynamic Zero Line that continuously adapts to changing market conditions.
Benefits:
* Stable trend reference
* Reduced lag compared to traditional trend filters
* Improved identification of directional shifts
---
## Adaptive Volatility Bands
The dynamic bands automatically adjust to current market conditions.
Benefits:
* Better extreme detection
* Improved volatility adaptation
* More reliable trend continuation analysis
* Reduced false signals during volatile periods
---
# Core Components
### x5 Z-Score
The primary trend oscillator.
Designed to reveal the dominant intraday trend rather than short-term market fluctuations.
---
### Dynamic Zero Line
The adaptive equilibrium level used to evaluate trend direction and market pressure.
Crosses above and below the Dynamic Zero Line often indicate significant shifts in trend structure.
---
### Relative Pressure Model
Measures the distance between the x5 Z-Score and the Dynamic Zero Line.
This provides insight into trend acceleration and momentum development.
---
### Adaptive Bands
Dynamic volatility bands that expand and contract with market activity.
They help identify stretched market conditions without relying on fixed thresholds.
---
### Momentum Histogram
The histogram visualizes bullish and bearish pressure relative to the Dynamic Zero Line.
Compared to the Chart Version, the x5 histogram is intentionally smoother and more trend-oriented.
---
# Signal Logic
Bullish conditions occur when the x5 Z-Score remains above the Dynamic Zero Line.
Bearish conditions occur when the x5 Z-Score remains below the Dynamic Zero Line.
Crossovers indicate potential shifts in the dominant intraday trend.
Because the x5 structure is intentionally slower, signals are generally more selective and reliable than those generated on the chart timeframe.
---
# How To Use
The x5 version is not intended to be used as a standalone entry tool.
Its primary purpose is trend confirmation.
Typical workflow:
### Bullish Environment
* x5 above Dynamic Zero
* Histogram positive
* Look for long setups on the Chart Version
---
### Bearish Environment
* x5 below Dynamic Zero
* Histogram negative
* Look for short setups on the Chart Version
---
### Neutral Environment
* x5 near Dynamic Zero
* Weak histogram pressure
* Reduced directional edge
---
# Multi-Timeframe Workflow
The x5 version acts as the middle layer of the NASDAQ Z-Score Framework.
Structure:
* x15 Version = Market Structure Layer
* x5 Version = Trend Confirmation Layer
* Chart Version = Execution Layer
This creates a complete top-down workflow:
1. Determine overall market bias using x15.
2. Confirm trend strength using x5.
3. Execute entries and exits using the Chart Version.
When all three layers align, directional confidence and trend quality are significantly improved.
---
# Best Markets
Optimized for:
* NASDAQ (US100)
* NQ Futures
* High-Momentum Index Markets
Can also be used on:
* S&P 500
* DAX
* Gold
* Bitcoin
Although the default settings were specifically calibrated for NASDAQ intraday behavior.
---
# Summary
NASDAQ Z-Score x5 FAST serves as the dedicated trend confirmation engine within the NASDAQ Z-Score Framework.
By combining a Dynamic Zero Line, Relative Pressure Analysis, Adaptive Volatility Bands, and a smoother trend-focused structure, the indicator helps traders identify the dominant intraday trend while filtering out lower timeframe noise.
Its primary role is not execution, but confirmation.
Used together with the Chart Version and x15 Version, it provides a powerful multi-timeframe framework for trend-following and momentum-based trading.
インジケーター
インジケーター
インジケーター

インジケーター

CVD Divergence
CVD Divergence highlights when price and Cumulative Volume Delta (CVD) disagree — a classic early warning that order-flow pressure is fading and a potential turning point may be forming.
How it works
The script builds a continuous CVD line by requesting lower-timeframe candles with request.security_lower_tf and summing their delta (up-volume minus down-volume) on every bar, without resetting per session. It then detects swing highs and lows (pivots) on the CVD line and compares each pivot to the previous one against the matching price pivot.
What it detects
- Regular Bullish — price makes a lower low while CVD makes a higher low (selling pressure fading).
- Regular Bearish — price makes a higher high while CVD makes a lower high (buying pressure fading).
- Hidden Bullish / Hidden Bearish — trend-continuation variants, off by default.
Each confirmed divergence is drawn as a line connecting the two CVD pivots, with a label (Bull / Bear / H Bull / H Bear). Four alert conditions are included so you can be notified automatically.
Settings
- Lower timeframe — resolution used to estimate delta (default 1 min).
- Pivot left / right length — swing sensitivity. Smaller values = more signals; larger = fewer but stronger.
- Min / Max pivot distance — allowed spacing between the two pivots being compared.
- Show Regular / Show Hidden — toggle each divergence family.
How to use
Treat divergences as context, not a standalone entry. They work best near support/resistance, prior highs/lows, or other confluence. Signals confirm only after the pivot's right-side bars complete, so they appear with an inherent delay and the latest swing may not be confirmed yet.
Notes & limitations
Standard chart data contains no true bid/ask tick information, so delta is approximated from lower-timeframe candle direction. Results are most reliable on liquid instruments with genuine volume (futures, crypto, major equities) and on intraday timeframes — on high timeframes the available lower-timeframe history is limited. For analysis and educational purposes only; not financial advice. インジケーター

インジケーター
インジケーター

インジケーター

Attique Golden Pocket IndicatorWhat this indicator does
Swing Fib draws a swing-based Fibonacci retracement grid on the price chart after the script decides there is a completed impulse leg between two anchored pivots. It is not a manual Fib tool: the anchors, direction (bull vs bear leg), and whether anything is drawn are all rule-based from pivot logic and a volatility filter.
The overlay includes:
A dashed blue line between the two swing anchors (the impulse leg).
Horizontal levels for a fixed set of retracement ratios (see below).
Optional Golden Pocket (GP) zone: two gold boundary lines (defaults 61.8% and 78.6% between the same anchors) and optional shading between them.
Optional retention of the previous fib when a new valid leg appears (prior leg is dimmed rather than deleted immediately).
How the anchors and “impulse” are defined
Pivots
The script uses TradingView’s standard pivothigh / pivotlow with configurable left and right bar counts:
Chart timeframe = Fib pivot timeframe (see next section): pivots use liqLeft / liqRight on the chart series.
Fib pivot timeframe higher than chart: pivots are read from the higher timeframe via request.security using fibPivotL / fibPivotR.
A pivot is only confirmed after right bars have printed to the right of the swing. Until then, the pivot can change or disappear on history as new bars form. That is normal pivot behavior, not a bug.
Bull vs bear leg (which fib you get)
Bullish fib leg: the script uses the most recently confirmed swing high and swing low such that the high pivot occurs after the low pivot in time, and high price > low price. Conceptually this is a push up from the swing low toward the swing high; retracements are measured back down from the high toward the low.
Bearish fib leg: the low pivot occurs after the high pivot, still with high price > low price (the swing high is the structural high of the leg). Conceptually a push down from the swing high toward the swing low; retracements are measured back up from the low toward the high.
ATR minimum range filter
Even if pivot structure qualifies, the fib does not draw unless the impulse range (high minus low of the anchored leg) is at least:
fibMinRangeAtrCh × ATR(atrLen)
This suppresses tiny, noisy swings. If the chart looks “empty,” lower fibMinRangeAtrCh slightly; if it is too busy, raise it.
How Fib prices are computed (important for reading the levels)
For both directions the math is anchored as:
0% = impulse high price, 100% = impulse low price
So the same formula maps ratios into the range between the two swing prices, with 0% at the top of the leg and 100% at the bottom. The BULLISH FIB vs BEARISH FIB title tells you which time ordering of pivots was used; the numeric labels still refer to that high → low retracement scale.
Standard levels drawn (labels match these ratios)
Between the anchored high and low, the script plots (from the high toward the low):
0%, 23.6%, 38.2%, 50%, 61.8%, 78.6%, 88.6%, then extension-style ratios −61.8%, −27.2%, −12.7%, and 100%.
You will also see two gold “GP” lines at the Golden Pocket inputs (defaults 61.8% and 78.6%). Because those defaults overlap the standard grid, you may see two lines near the same prices (one from the standard set, one from GP styling). That is intentional: GP is visually emphasized.
Chart timeframe vs higher-timeframe Fib
The script compares the chart period to fibAnchorTf using seconds, not fragile string matching.
Match (same duration as chart): anchors use xloc.bar_index (bar indices). The fib aligns exactly with how you see swings on that timeframe.
Higher fibAnchorTf than chart: anchors use higher-timeframe pivot prices and the pivot bar’s time on that HTF, and drawings use xloc.bar_time so the grid lines up in time on your lower chart.
Practical rule: If you want the fib to match what you see on the current chart swings, set fibAnchorTf = your chart timeframe. If you want a structure map from a slower TF (for example 15m or 1h swings on a 1m or 2m chart), set fibAnchorTf higher and accept that the leg definition is HTF pivot-based, not the same as every small chart swing.
Visual and UX options
Extend levels right: horizontal lines extend to the right by fibExtendBarsCh bars (and update as bar_index advances).
Level labels: optional text for each ratio; position Right, Left, or Middle along the span.
Prior fib: optional freeze + dim of the last fib when a new valid leg forms, useful for comparing previous vs current swing context.
インジケーター

MARKET OS [Viprasol]MARKET OS — Cost-Aware Regime & Signal Engine
═══════════════════════════════════════════════════════════
THE IDEA IN ONE LINE
═══════════════════════════════════════════════════════════
Most indicators read one thing — trend, volume, or structure — and leave you
to guess the rest. MARKET OS reads the market across four independent
dimensions at once, fuses them into a single 0-100 Market Score, and grades
every signal A/B/C — including something no other signal engine on
TradingView shows: the estimated ROUND-TRIP TRADING COST of taking that
signal, stamped right on the label.
═══════════════════════════════════════════════════════════
THE FOUR DIMENSIONS
═══════════════════════════════════════════════════════════
1. DIRECTION — adaptive trend + market structure
A Kaufman Adaptive Moving Average (KAMA) baseline that hugs price in
trends and slows down in chop, combined with swing structure tracking
(BOS continuation counts and CHoCH reversals with a configurable
confirmation requirement). Direction scores highest when adaptive trend
and structure AGREE.
2. QUALITY — efficiency regime
The Kaufman Efficiency Ratio (0 = pure chop, 1 = perfect one-way move)
classifies the environment as TRENDING / TRANSITION / CHOPPY. A breakout
in a trending regime and the same breakout in chop are not the same trade
— this dimension prices that difference into the score.
3. PARTICIPATION — effort vs result (Wyckoff)
Relative volume (EFFORT) is compared against ATR-normalized price movement
(RESULT) on every bar:
• High effort + high result = CONVICTION (real participation)
• High effort + low result = ABSORPTION (volume swallowed — warning
crosses on the chart; a classic exhaustion footprint)
• Low effort + high result = THIN MOVE (prone to fade)
4. COST — EDGE effective spread (the genuinely new part)
The engine embeds the EDGE estimator from Ardia, Guidotti & Kroencke,
"Efficient Estimation of Bid-Ask Spreads from Open, High, Low, and Close
Prices", Journal of Financial Economics 161 (2024) — an asymptotically
unbiased estimator of the effective bid-ask spread computed from nothing
but OHLC bars. The current spread is ranked against the symbol's own
history, so the engine knows when this market is CHEAP or EXPENSIVE to
trade. To my knowledge this is the first TradingView signal engine that
measures its own trading cost.
═══════════════════════════════════════════════════════════
THE FUSION: MARKET SCORE & STATE
═══════════════════════════════════════════════════════════
The four dimensions are combined into a weighted composite score
(Direction 30%, Quality 30%, Participation 25%, Cost 15%):
75-100 ◆ PRIME — everything aligned, cheap to trade
55-74 ◆ FAVORABLE — good conditions
35-54 ◆ MIXED — partial alignment
0-34 ◆ HOSTILE — choppy / absorbed / expensive (background shaded)
Candles are colored on a continuous gradient from neutral gray to full trend
color as the score rises — you can see environment quality at a glance,
without reading a single number.
═══════════════════════════════════════════════════════════
SIGNALS — GRADED AND COST-STAMPED
═══════════════════════════════════════════════════════════
Entries are structure reversals (CHoCH) confirmed by the adaptive trend,
gated by a minimum score, and stamped with:
▲ LONG
Score 82
Cost 4.2t / Tgt 38t (11.1%)
That last line is the engine's cost-awareness: estimated round-trip spread
cost in ticks, your ATR-based target in ticks, and the percentage of your
target the spread will consume. If the cost eats 25%+ of the target, an
alert can tell you the trade is structurally overpriced — BEFORE you take it.
C-grade signals (reversal fired, but the environment scored poorly) are
hidden by default. They look like signals and trade like donations.
═══════════════════════════════════════════════════════════
HOW TO USE
═══════════════════════════════════════════════════════════
1. Pick a Preset: Fast (1-15m), Default (15m-1H), Smooth (1H+).
2. Trade A-grade signals in PRIME/FAVORABLE states, in the signal direction.
3. Treat ABSORPTION crosses as early reversal warnings.
4. Check the Round-Trip Cost row before entering — if the spread eats a
large slice of your target, size down, widen the target, or skip.
5. Use HOSTILE shading as a stand-aside filter.
6. Raise "Minimum Score to Signal" for fewer, cleaner entries.
═══════════════════════════════════════════════════════════
SETTINGS
═══════════════════════════════════════════════════════════
Engine — preset, KAMA length, structure pivot width.
Quality — ER smoothing and trending/choppy thresholds.
Participation — effort and result thresholds.
Cost — EDGE window, cost-regime lookback, target size in ATR multiples.
Signals — minimum score, C-grade visibility, BOS-before-flip, cooldown.
Visuals — colors, adaptive cloud, structure levels, gradient candles,
hostile shading, absorption markers.
Dashboard — position and size.
Alerts (8): Long, Short, A-Grade Signal, Prime State, Hostile State,
Absorption, High Cost Regime, Cost Eats Edge (≥25% of target).
═══════════════════════════════════════════════════════════
HONEST LIMITATIONS
═══════════════════════════════════════════════════════════
• The EDGE estimator is asymptotic — short windows are noisy, and on very
illiquid symbols or synthetic OHLC feeds (some forex/CFD data) the cost
dimension degrades; the engine then treats cost as neutral rather than
fabricating a number.
• Volume-based participation requires reliable volume data.
• Structure detection depends on pivot settings and timeframe.
• The score weights encode a judgment (direction and quality matter most);
they are not optimized parameters and you should not treat the score as a
probability.
• This is an analytical decision-support tool, not a trading system. Past
performance does not guarantee future results. Not financial advice.
═══════════════════════════════════════════════════════════
CREDITS & ORIGINALITY
═══════════════════════════════════════════════════════════
The EDGE estimator methodology belongs to David Ardia, Emanuele Guidotti and
Tim A. Kroencke (Journal of Financial Economics 161, 2024, 103916,
doi 10.1016/j.jfineco.2024.103916). KAMA and the Efficiency Ratio are Perry
Kaufman's public concepts; Effort-vs-Result is a Wyckoff principle. All code
in this script — the Pine implementation of EDGE from the published formulas,
the four-dimension fusion model, the composite scoring and state machine, the
cost-stamped signal engine, and all visualization — is original Viprasol work
written from scratch for this indicator. No third-party Pine code is reused.
インジケーター

インジケーター

インジケーター

インジケーター