ストラテジー
ビル・ウィリアムズのインジケーター

gold longer bulishThe US Dollar (USD) softens after reports that Iran’s Foreign Minister Abbas Araghchi is expected in Islamabad on Friday night, according to Al Arabiya. Iran’s state news agency IRNA said the visit is for talks with Pakistani officials, not with the US for now. Still, the news has slightly improved hopes for future talks, offering some support to Gold.
On the data front, the University of Michigan’s Consumer Sentiment Index fell to 49.8 in April from 53.3 in March. The Consumer Expectations Index also declined to 48.1 from 51.7, pointing to a weaker outlook. Meanwhile, 1-year inflation expectations surged to 4.7% from 3.8% in March, while the 5-year outlook rose to 3.5%, marking the highest level since October 2025.
インジケーター

インジケーター

A Strategy Optimized - EMA Fibonacci Scaling PullbackThis is the optimized version of EMA + Fibonacci Scaling Pullback Strategy.
Key Improvements:
- Relaxed RSI (>45) and ADX (>15) filters to increase trade frequency
- 2-batch scaling in for better practicality
- Designed for slow grind up + multiple pullback markets
- Low risk with ATR-based stop loss and partial profit taking
Timeframe: Daily (trend filter) + 4H (entry)
Suitable for BTC, ETH, SOL in current oscillating upward phase.
ストラテジー
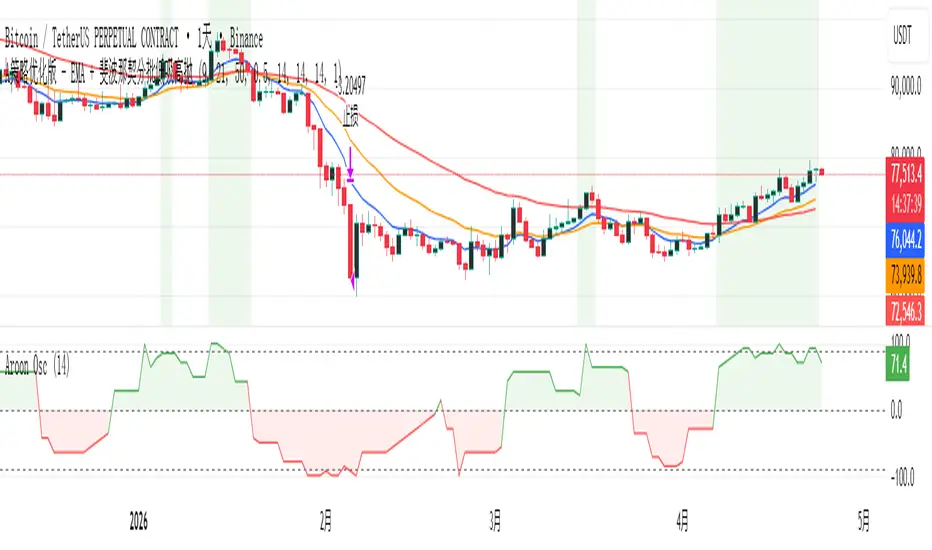
Steph CAMARA Template + EMA100Template nom + EMA 100 intégrée. permet d'affiche un slogan et ton nom sur le graphique avec la moyenne mobile exponentielle 100
インジケーター

JRI SMC v16ASHBOARD — TOP RIGHT
Date + Session
Live date, Asia/London/NY/Off
Active Trade
LONG/SHORT/FLAT — entry, SL, next target
Daily Stats
W count, L count, Win Rate %
Trade Lock
STOP TRADING after 2 losses
7 Conditions
All shown with values not just YES/NO
CHART ELEMENTS
Sessions
Green=NY · Blue=London · Purple=Asia
Key levels
100pt intervals extending forward, labeled
ATH / ATL
Step lines tracking all time high/low
Supply zones
Red boxes — confirmed with 2+ rejections
Demand zones
Green boxes — confirmed with 2+ rejections
HH/HL/LH/LL
Every swing pivot labeled
BOS lines
Dashed break of structure with label
Institution candles
2x avg body — subtle background highlight
Liquidity sweeps
LIQ SWEEP label on wicks
WATCH DEMAND/SUPPLY
Zone touch early warning
EMA cloud
20/50 EMA with fill
VWAP
Daily VWAP step line
SIGNALS
Min score
6/7 conditions required
Signal cooldown
6x swing length on 1m/5m · 3x on higher TFs
Entry
Shows on signal candle, enter NEXT candle open
SL on BUY
Below candle low with ATR buffer
SL on SELL
Above candle high with ATR buffer
T1 — 1:1 R
Take partial here
T2 — 1:2 R
Move SL to entry
T3 — 1:3 R
Full target — trade closes as WIN
ALERTS (9 TOTAL)
JRI BUY
Full signal — enter next open
JRI SELL
Full signal — enter next open
JRI Watch Demand
Price just entered demand zone
JRI Watch Supply
Price just entered supply zone
JRI STOP TRADING
Max losses hit
JRI Bullish/Bearish
Structure shift confirmed
JRI Liq High/Low
Liquidity sweep detected
1
インジケーター

Premium/Discount Retracement IndicatorThe indicator works in four layers.
**The major swing** — it scans the chart for a significant impulse move using a pivot-based lookback. Once it finds a clear swing low and swing high (or high then low), it locks that range in and draws a horizontal 50% line across the middle. Everything above that line is premium, everything below is discount.
**The retracement zone** — after the major move, it watches for a smaller pullback forming within the range. When that pullback produces its own local high and local low, those two levels become the zone boundaries. The zone is drawn as a two-colour box: teal on top, red on the bottom, split at the midpoint. Only zones sitting in the discount area qualify for buys, and only zones in the premium area qualify for sells, so it automatically filters out setups that go against the structure.
**The entry** — a limit order line sits at the exact midpoint of the zone. Nothing happens until price returns to that level. If price dips into the zone but reverses before touching the midpoint and then closes back above the zone boundary, the zone is marked as rejected and the limit is cancelled automatically. This handles the scenario where price taps the upper portion of the zone but doesn't commit.
**Trade levels** — once the limit is hit, three levels are displayed. The stop loss is placed just beyond the outer zone boundary with a small buffer. The take profit is calculated at 1:2 risk-to-reward from the entry. A break-even line sits at the 1:1 level, and an alert fires when price reaches it so you know when to move your stop to entry.
There are also four alerts: zone created, order filled, zone cancelled, and move to break even.
インジケーター

インジケーター

インジケーター
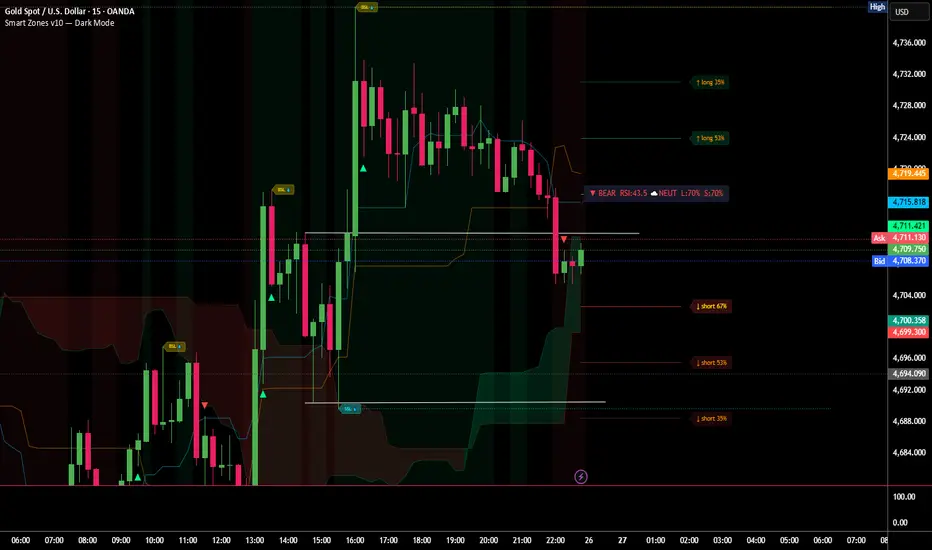
Moving Averages and Bollinger BandsBollinger Bands and Moving Average, this help us to get zones to make long or short entry position
インジケーター
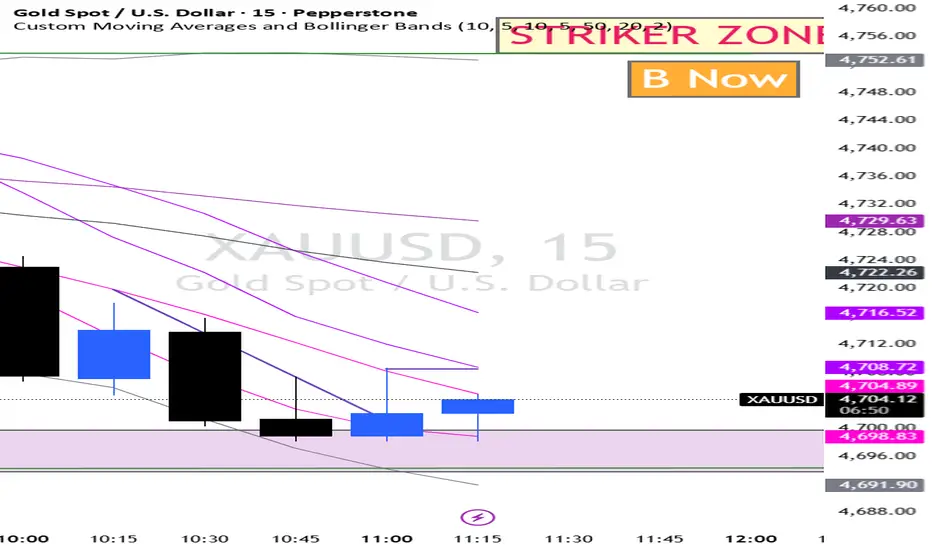
MTF Price Line SNIPER AUTOA professional multi-timeframe price line overlay designed to visualize market structure, momentum, and higher-timeframe context in a single, clean view. This tool replaces traditional candles with smooth price lines and provides flexible combinations for different trading styles—from fast M1 scalping to higher-timeframe bias analysis.
Core Concept
The indicator plots multiple dynamically scaled price lines based on the current chart timeframe:
Chart TF (M1 / current TF) → Entry & execution
x5 → Short-term flow
x15 → Intraday trend structure
H1 → Higher-timeframe context
H4 → Macro direction
All higher timeframes are automatically recalculated relative to your current chart timeframe. This ensures consistency whether you are on M1, M5, or M15—without using traditional HTF requests (no step-like plotting).
Key Features
Smooth Line Rendering
No stair-stepping. All lines are synthetically calculated for a continuous, fluid appearance.
Auto Multi-Timeframe Scaling
Timeframes adjust automatically when switching charts (e.g., M1 → M5 → M15).
Independent Visibility Controls
Each timeframe (Chart, x5, x15, H1, H4) can be individually enabled or disabled.
Customizable Appearance
Fully adjustable colors and line widths for each timeframe.
Momentum Coloring (M1)
Optional neon-based momentum coloring on the chart timeframe:
Green → bullish momentum
Red → bearish momentum
Momentum Overlay on x15 (Optional)
The x15 line can reflect M1 momentum, allowing you to view lower-timeframe pressure within higher-timeframe structure.
RSI-Based Coloring (Optional)
Global RSI filter for overbought/oversold conditions across all lines.
How to Use
1. Pure Line Chart Mode
Disable TradingView candles
Use only the indicator lines
→ Clean structure view (ideal for flow & trend reading)
2. Hybrid Mode (Recommended)
Keep TradingView candles ON
Disable selected lines (e.g., Chart TF or x5)
Example:
Candles ON
Chart line OFF
x5 ON
→ You get candles for execution + x5 flow overlay
Typical Configurations
Scalping (M1)
Chart TF: ON
x5: ON
x15: optional
H1/H4: OFF
Sniper Entries
Chart TF: ON
x5: ON
x15: ON
Bias / Direction
x15: ON
H1: ON
H4: ON
Chart TF: optional
Interpretation
Alignment across timeframes → high-probability moves
Chart TF leads, higher TFs follow → confirms trend development
Divergence between TFs → pullback or weak structure
Flat / crossing lines → ranging market (low quality conditions)
Important Notes
This is a synthetic MTF model, not a direct higher-timeframe feed
Designed for clarity and responsiveness, not lagging confirmation
Best used in combination with your execution logic
Summary
MTF Price Line SNIPER transforms raw price into a structured, multi-layered visual system:
Entry timing (M1)
Flow (x5)
Trend (x15)
Context (H1 / H4)
All in one adaptive, customizable overlay.
インジケーター

ストラテジー

ストラテジー

インジケーター

Apex Price Patterns & Candlestick Engine [Pineify]Apex Price Patterns & Candlestick Engine
Apex Price Patterns & Candlestick Engine combines EMA trend context, confirmed swing structure, and selected candlestick formations. It filters pattern labels by regime: bullish patterns print only when the fast EMA is above the slow EMA, and bearish patterns print only when the fast EMA is below the slow EMA.
Key Features
Fast/slow EMA filter for bullish, bearish, or neutral trend state
Confirmed HH, HL, LH, and LL labels from pivot highs and lows
Trend-aligned hammer, shooting star, engulfing, morning star, and evening star labels
Trend candle coloring, EMA plots, dashboard, and alerts
How It Works
The script calculates a fast EMA and slow EMA . Their relationship defines trend state and controls candle coloring, the dashboard, and signal eligibility.
Market structure comes from ta.pivothigh() and ta.pivotlow() . A swing confirms only after the selected number of bars has passed on both sides, creating a known delay but keeping labels stable. Pivot highs mark HH or LH; pivot lows mark HL or LL.
The candle engine measures range, body width, wick percentages, and average body size. Wick/body imbalance detects hammers and shooting stars. Engulfing logic requires an opposite-color prior candle and meaningful current body. Morning and evening stars use a three-candle sequence.
How the Components Work Together
EMA trend defines bias, pivots define structure, and candle patterns provide timing. A bullish label after an HL in an EMA uptrend may highlight a pullback rejection. A bearish label after an LH in an EMA downtrend may highlight a failed rally.
Trading Ideas and Insights
Use bullish labels near HL structure as possible trend-continuation context
Use bearish labels near LH structure as possible downtrend-continuation context
Compare HH/HL or LH/LL sequences against the EMA state to spot agreement or conflict
Signals are context aids, not standalone trade instructions.
Unique Aspects
Pattern labels are trend-filtered instead of printed everywhere
Structure uses confirmed pivots rather than raw highs and lows
Trend, latest structure, and EMA relationship are summarized together
How to Use
Add the indicator and check the dashboard trend state
Read recent HH/HL/LH/LL labels to judge structure
Watch for trend-aligned candle labels near recent swing areas
Set alerts for pattern or structure events
Customization
Fast EMA Length (default: 20) — Short trend filter; lower values react faster
Slow EMA Length (default: 50) — Baseline trend filter; higher values change slower
Swing Pivot Length (default: 10) — Bars required on both sides of a swing
Visual Toggles — Show or hide labels, candle coloring, and dashboard
Conclusion
This indicator is for traders who read trend, structure, and candles together. Its value is showing when EMA direction, confirmed pivots, and proportion-based candlestick patterns are aligned.
インジケーター

NASDAQ Flow Profile PRO CLEAN MTF + LTFThis indicator delivers a multi-timeframe volume-weighted flow profile designed specifically for fast markets like NASDAQ. It combines Main TF, Higher Timeframes (HTF), and Lower Timeframe (LTF) structure into a single, clean visual framework — without repainting or external data requests.
🔍 Core Concept
Instead of using traditional fixed volume profile tools, this script dynamically calculates:
POC (Point of Control) → volume-weighted average price
VAH (Value Area High) → upper deviation from POC
VAL (Value Area Low) → lower deviation from POC
All levels are derived using:
Pure price × volume weighting
Rolling lookback windows
Standard deviation–based value areas
This creates a live, adaptive flow profile that reacts instantly to market conditions.
⚙️ Multi-Timeframe Engine
🟡 Main Timeframe (Chart TF)
Core structure of the current market
Smoothed using EMA for clarity
Defines the active trading range
🟠 HTF x5 (Higher Timeframe)
Mid-term directional bias
Filters noise and highlights institutional flow zones
🔵 HTF x15 (Higher Timeframe)
Macro structure
Identifies major accumulation/distribution areas
All HTF levels are calculated internally using length multiplication, not request.security, ensuring:
No repainting
Perfect alignment with the current chart
⚡ LTF Precision Layer
⚪ Lower Timeframe (LTF)
Ultra-fast microstructure detection
Uses reduced lookback + tighter value area (ltfTight)
Ideal for:
Entries
Scalping confirmation
Fine-tuning execution
🎯 Key Features
✅ True volume-weighted POC calculation (not approximated)
✅ Dynamic Value Areas using variance & standard deviation
✅ Full MTF stacking (x1 / x5 / x15)
✅ Integrated LTF microstructure layer
✅ Independent visibility toggles for all components
✅ Clean EMA smoothing (no lag-heavy filters)
✅ Fully customizable colors
✅ Overlay directly on price chart
🚀 What’s Improved vs. Standard / Original Versions
🔥 Added LTF Layer
→ Most flow/profile indicators only show HTF bias.
→ This version adds a true lower timeframe execution layer.
🔥 No request.security Usage
→ Eliminates repainting and sync issues
→ Uses mathematical TF projection (length scaling) instead
🔥 Cleaner Visualization
→ Removed unsupported dashed styles
→ Replaced with transparency-based hierarchy
🔥 Optimized for NASDAQ
→ Faster reaction via shorter default lookback
→ Better suited for M1 / M5 scalping
🔥 More Accurate VA Calculation
→ Uses volume-weighted variance, not simple price deviation
🔥 Performance Optimized
→ Lightweight loops
→ No external data calls
→ Stable even on low timeframes
🧠 How to Use
Price above POC → bullish control
Price below POC → bearish control
VAH = potential resistance
VAL = potential support
Best Confluence:
LTF aligns with HTF direction → high-probability entry
Price reacts at HTF VA zones → institutional levels
Compression between VAH/VAL → breakout potential
🏁 Summary
This is not a classic volume profile.
It’s a real-time flow engine that maps:
Microstructure (LTF)
Current structure (Main TF)
Macro bias (HTF)
All in one — clean, fast, and built for precision trading.
インジケーター

CREA Composite MA v3Here's a clean description you can use as the indicator's published description on TradingView:
CREA Composite MA v3 — Multi-Layer Confluence Indicator
CREA Composite MA is a momentum and trend confluence engine disguised as a moving average. Rather than plotting a single indicator, it combines seven sub-indicators into one normalised 0–100 composite score, then runs that score through three layers of confirmation before generating a signal.
The seven components:
EMA Bias (EMA10/20 stack and price position)
MFI (Money Flow Index)
ADX with +DI/−DI directional spread
Volatility (inverse ATR%, environment-adjusted)
Delta (candle body direction and size)
Volume (Z-score, directionally weighted)
Momentum (Rate of Change, normalised)
Each component is independently normalised to 0–100. Scores above 50 are bullish, below 50 are bearish. All weights are fully adjustable.
Three confirmation layers:
Layer 1 — Component agreement: counts how many of the 7 sub-indicators individually agree with the direction. A composite score of 65 built on 6/7 components is treated differently from one built on 2 components spiking hard.
Layer 2 — HTF filter: rebuilds the full composite on a user-selected higher timeframe (default 15m) and gates signals accordingly. Bull signals are suppressed when the HTF composite is bearish, and vice versa. The HTF line is plotted directly on the pane so both timeframes are visible simultaneously.
Layer 3 — Score velocity: measures the 3-bar rate of change of the composite itself. A rising score carries more weight than a flat one at the same level.
Two-tier signal system:
EARLY (yellow) — fires on signal line crossover when ≥4/7 components agree and HTF is aligned. Appears before the threshold is reached, giving advance warning of a potential confirmed signal.
CONFIRMED (green/red) — fires on threshold cross when ≥5/7 components agree and HTF is aligned. Labelled with confidence tier (HIGH / MED / LOW) and agreement count (e.g. BULL HIGH 6/7).
BLOCKED (gray) — threshold was crossed but confirmation gates rejected it. Useful for auditing filter performance.
Confidence tiers:
HIGH — 6–7 components agree + velocity moving in signal direction
MED — 5+ components agree
LOW — 4+ components agree
HUD table (bottom-right) shows all seven component scores in real time, color-coded by strength, alongside the composite score, HTF score and bias, confidence tier, and velocity direction.
7 alert conditions included: Early Bull/Bear, Confirmed Bull/Bear, Blocked Bull/Bear, and HIGH Confidence.
All lengths, weights, thresholds, and filter settings are fully configurable via the settings panel.
インジケーター

インジケーター

VIX Clean Dashboard (London & NY ) (LACERDAThe VIX Clean Dashboard is an essential Heads-Up Display (HUD) for day traders and macro analysts who need to track the exact expansion and contraction phases of market volatility (VIX / VXN) during the core liquidity sessions.
Unlike standard VIX indicators that rely on delayed feeds or dead overnight data, this script pulls continuous, gapless data from the curated 24/7 tape. It mathematically anchors the base 0% to the previous daily close and tracks real-time percentages flawlessly across global sessions.
✨ Key Features & Mechanics:
London Lock (03:00 EST): Automatically captures and locks the exact VIX percentage at the start of the European cash session. This allows you to instantly gauge the overnight macro sentiment before the US wakes up.
New York Anchor (09:30 EST): Records the precise VIX percentage at the ringing of the Wall Street opening bell.
Real-Time Extremes (Max/Min): Once NY opens, the dashboard actively hunts and records the absolute Highest and Lowest VIX percentages reached during the intraday session.
Live Delta (Δ) Tracking: The most powerful feature of the dashboard. Next to the Current, Max, and Min values, it displays the live Delta (Δ) — dynamically calculating exactly how much volatility has expanded (Red/Danger) or contracted (Green/Risk-On) relative to the 09:30 AM New York Open.
Selectable Feeds: Choose between the 24/7 seamless S&P 500 (TVC:VIX) for global macro reading, or Nasdaq (USI:VXN) for tech-heavy volatility trading.
Non-Intrusive Design: A transparent, sleek UI table that can be repositioned anywhere on your chart (e.g., Middle Right) to keep your candlesticks perfectly clean.
How to Use: Keep this dashboard running on your main index chart (SPX, ES, NQ, MNQ). If the Current Delta (Δ) is flashing green and dropping negative relative to the NY Open, volatility is being crushed, signaling a strong environment for equities to rally. If the Delta is strictly positive and pushing towards the VIX Máximo, the market is pricing in fear/hedging, signaling heavy intraday resistance or sell-offs for equities.
インジケーター

Leader NASDAQ (Shape Matcher & MTF Bias) (LACERDA)The Leader NASDAQ is an advanced, real-time correlation dashboard designed for index traders who want to track the global macro ecosystem and identify which assets are currently driving the NASDAQ's price action.
Instead of just showing absolute percentage changes, this script utilizes a sophisticated "Shape Matcher" (Cumulative Deviation) algorithm. At the exact opening of each major global liquidity session (Asia, London, and New York), the script anchors the opening price of the NASDAQ and your custom watchlist to 0%. Minute by minute, it calculates the cumulative deviation between the NASDAQ's intraday performance curve and every tracked asset's curve.
The dashboard actively filters and displays the Top 2 "Leaders" for each active session—meaning it isolates the specific assets whose intraday price action most perfectly correlates with the NASDAQ at that exact moment.
✨ Key Features:
Three-Session Tracking: Automatically segmented into Asia (Pacific liquidity), London (European macro), and New York (Core volume) sessions.
Shape-Matching Logic: Finds the "gravitational pull" of the market. If NVIDIA or TSMC is dictating the Nasdaq's movement, the script will mathematically identify them as the session leaders by having the lowest cumulative error.
Live Trend Indicators: Quick-glance visual cues next to each leader. A Green circle (🟢) means the asset is currently trading above its session open (bullish pull), while a Red circle (🔴) indicates it's dragging below its open (bearish pull).
Highly Customizable: You can input up to 8 assets for Asia, 8 for London, and 9 for New York via the indicator settings. Perfect for monitoring the "Magnificent Seven", key semiconductors (like ASML, TSMC), and global indices (DAX, Nikkei 225, KOSPI).
Non-Intrusive HUD: A sleek, borderless table overlay that can be positioned anywhere on your chart (Top Right, Bottom Left, etc.) without cluttering your technical analysis.
How to Use:
Apply the indicator to your chart (optimally a NASDAQ/MNQ chart).
Open the Indicator Settings (⚙️).
Type in your favorite market-driving tickers for each session (e.g., AAPL, NVDA, NI225, FDAX1!, USDJPY).
Watch the dashboard dynamically update to show you where the smart money and heavy correlation currently reside!
インジケーター

CryptoLat Trend + Momentum EntryThis indicator combines trend-following and momentum confirmation into a simplified entry model.
It uses a dual moving average structure (fast and slow EMA) to define directional bias, and a momentum filter (RSI) to validate entry conditions and reduce noise.
How it works:
- Trend is defined using the relationship between the fast EMA and slow EMA.
- Long conditions require:
- Uptrend confirmation (fast EMA above slow EMA)
- Price trading above the fast EMA
- RSI strength above a defined threshold
- Short conditions require:
- Downtrend confirmation (fast EMA below slow EMA)
- Price trading below the fast EMA
- RSI weakness below a defined threshold
This layered approach aims to:
- Avoid counter-trend entries
- Filter weak signals
- Provide cleaner momentum-based entries aligned with trend direction
The background coloring provides an additional visual context of the prevailing trend environment.
This tool is designed for traders looking for a structured and simplified way to combine trend and momentum without overcomplicating their charts.
インジケーター

SSO / SPY Rotation - Weekly RSI(40) vs MA(100) A1A rotational divergence has emerged between the 17-period harmonic midpoint oscillator and the inverse liquidity gradient, suggesting a temporary compression in directional bias. This condition typically precedes a pseudo-breakout event when paired with declining intraday entropy.
Price is currently hovering within a neutral expansion band, but the signal is triggered by a misalignment between short-cycle momentum curvature and higher timeframe drift velocity. When this occurs, historical patterns indicate a tendency for price to resolve upward—provided that volatility remains directionally ambiguous.
The model identifies a “soft inflection zone,” where neither buyers nor sellers maintain structural control, yet micro-trend accumulation begins to favor upward resolution through passive order flow absorption.
インジケーター

SSO / SPY Rotation - Weekly RSI(40) vs MA(100)This is a strategy that uses moving averages to provide guidance on when to sell and buy certain positions.
インジケーター
