STP Trade Idea AnalysisThe STP Trade Idea Analysis Indicator is a conditional price-path projection engine designed to help traders evaluate potential market direction, important reaction levels, and alternative price scenarios directly on the chart.
Rather than relying on a single technical signal, the indicator combines multiple forms of market structure and price action analysis to provide a clearer view of where price may move next. The system evaluates Elliott-wave structure, Fibonacci levels, Fair Value Gaps (FVGs), Supply and Demand, trend information, and technical confluence to identify meaningful areas of support, resistance, and potential price reactions.
A key feature is the Primary and Secondary Elliott price paths. The Primary path represents the currently favored scenario based on the available market structure, while the Secondary path provides an alternative if price action develops differently. These paths are conditional projections rather than fixed predictions and can adjust as new market information becomes available.
Key Features
Conditional Price-Path Projection – Displays Primary and Secondary Elliott-style scenarios based on current market structure.
Primary Elliott Path – Shows the currently favored 1–5 impulse and A–B–C corrective price path.
Secondary Elliott Path – Displays an alternative scenario if market structure begins to shift.
Fibonacci Levels – R1–R4 and S1–S4 levels derived from the 6:00 AM ET anchor and prior regular-session trading range.
Bullish FVGs – Green shaded areas identify bullish price imbalances that may act as future reaction or support zones.
Bearish FVGs – Red shaded areas identify bearish price imbalances that may act as future reaction or resistance zones.
Supply and Demand Zones – Identify areas where buying or selling pressure may influence future price action.
Confluence Support and Resistance – Highlights important decision zones where multiple independent technical levels cluster.
21 and 50 EMAs – Provide additional visual context for trend direction and price structure.
How to Use the Indicator
For the clearest analysis, I recommend using the indicator primarily on the 1-hour and Daily charts.
Start with the Daily chart to understand the larger market structure, longer-term trend, major support and resistance areas, and the broader Primary and Secondary price-path scenarios. This provides the higher-timeframe context for the trade.
Next, move to the 1-hour chart for a more detailed view of the current setup. Use the 1-hour chart to evaluate developing Elliott structure, FVGs, Fibonacci levels, Supply and Demand, and nearby confluence zones.
Pay particular attention to the Primary Elliott path. This represents the currently favored scenario based on the market information available to the indicator. The Secondary Elliott path should not be ignored. It represents an alternative scenario and can help identify where your original trade thesis may be weakening or where market structure may be changing.
Use the Confluence Support and Resistance zones as potential decision areas. These zones are especially important because they represent areas where multiple independent technical factors cluster, rather than a level derived from a single calculation.
Bullish and Bearish FVG shaded zones can provide additional context. Watch how price behaves as it approaches or enters these imbalances. A reaction, rejection, continuation, or fill can provide useful information about whether the Primary price path remains intact.
The Fibonacci R1–R4 and S1–S4 levels provide additional reference points for potential price reactions and targets. They are established using the 6:00 AM ET anchor and prior regular-session range.
Suggested Workflow
1. Start with the Daily chart
Identify the broader trend, Elliott scenario, major zones, and directional context.
2. Move to the 1-hour chart
Evaluate the current price structure and more actionable Primary and Secondary paths.
3. Identify Confluence Support and Resistance
Look for areas where price may react, consolidate, reverse, or break through.
4. Review FVGs and Fibonacci Levels
Use these as additional confirmation and as potential areas for reaction.
5. Compare the Primary and Secondary paths
The Primary path represents the favored scenario. The Secondary path helps you prepare for an alternative outcome.
6. Let price action confirm the scenario
The projected path should be used as a roadmap, not as a guarantee. As price structure changes, the favored scenario can change as well.
Understanding the Projection
The goal of the indicator is not to predict an exact future price. Instead, it provides a structured framework for answering a more useful trading question:
If the current market structure continues, what is the most probable price path, and what alternative path should I be prepared for if conditions change?
Using the Daily chart for broader context and the 1-hour chart for trade analysis allows traders to evaluate both the larger market structure and the developing setup before making a trading decision.
Important: The STP Trade Idea Analysis Indicator is intended for technical analysis, education, and trade planning. Primary and Secondary price paths are conditional scenarios based on available market data and should not be interpreted as guaranteed future price movements.
インジケーター

Supertrend + Fibonacci OTE Grid & Bands [BigBeluga]🔵 OVERVIEW
The Supertrend + Fibonacci OTE Grid & Bands is an advanced technical analysis indicator designed by BigBeluga to combine trend-following Supertrend mechanics with dynamic Fibonacci retracement grids and volatility-based channel bands directly on the chart. Traditional Supertrend systems rely solely on stop lines, often missing optimal retracement zones (OTE) during trend pullbacks. To solve this limitation, this script integrates dual operating modes—anchored OTE grids that project Fibonacci levels across active trend swings, and continuous Fibonacci channel bands scaled by Average True Range (ATR).
The indicator visualizes trend direction, dynamic stop losses, shaded OTE zones, and proximity-highlighted grid levels. The core calculations track trend swings using customizable ATR lookbacks, compute proportional Fibonacci levels (0.0 to 1.0), and dynamically adjust line widths and colors when price approaches specific thresholds. Custom color palettes, bar/candle color toggles, and label configurations allow traders to fine-tune visual settings across various timeframes and asset classes.
🔵 HOW IT WORKS
The system operates through an integrated architecture where each component dynamically influences chart behavior:
1 — Supertrend Trend & Swing Engine
Stop Loss Line & Fills: Computes volatility-scaled Supertrend lines using ATR parameters, plotting colored stop-loss streams with gradient area fills.
Trend Extreme Tracking: Automatically tracks trend highs and lows upon trend direction flips to anchor structural Fibonacci calculations.
2 — Dual Fibonacci Modes (OTE Grid & Bands)
OTE Grid Mode: Projects an anchored Fibonacci retracement grid (0.0, 0.236, 0.382, 0.500, 0.618, 0.705, 0.786, 1.000) across the active trend swing, complete with a shaded Optimal Trade Entry (OTE) zone between the 0.618 and 0.786 levels.
Fibonacci Bands Mode: Plots continuous, ATR-scaled channel bands extending outward from the Supertrend line using proportional ratio offsets.
3 — Proximity Highlight & Styling Engine
Price Proximity Detection: Measures distance between price and individual grid levels using ATR multipliers to dynamically highlight active levels with distinct colors and thicker line widths.
Visual Customization: Supports bar and custom candle coloring by trend, adjustable line styles (Solid, Dotted, Dashed), and dynamic right-edge price labels.
🔵 HOW TO USE
Apart from serving as a comprehensive trend and retracement mapping tool, the indicator can be applied in several ways:
Follow Trend Momentum: Stay aligned with prevailing market direction by monitoring the Supertrend line color and trend-colored candles/bars.
Identify OTE Retracement Zones: In OTE Grid mode, monitor the shaded zone between the 0.618 and 0.786 Fibonacci levels for potential trend continuation entries during pullbacks.
Track Key Level Interactions: Watch for automatic color highlights and width changes on grid levels as price approaches critical Fibonacci thresholds.
🔵 SETTINGS
The indicator includes several customizable configuration groups to tailor calculations and visual styling to your trading style:
General Settings: Select between OTE Grid and Fibonacci Bands modes, toggle right-edge price/ratio labels, choose grid line styles (Solid, Dotted, Dashed), adjust grid highlight distance thresholds via ATR multipliers, and enable dimming for non-OTE levels.
Supertrend Parameters: Configure the ATR Period and Multiplier to adjust the sensitivity and distance of the core stop-loss line.
Fibonacci Bands Parameters: Define the ATR period and outer band multiplier specifically used when operating in Fibonacci Bands mode.
Main Styling & Colors: Set bullish and active price highlight colors, and toggle bar/candle coloring based on the active trend direction.
Fibonacci Level Settings: Enable or disable individual Fibonacci ratios (0.000, 0.236, 0.382, 0.500, 0.618, 0.705, 0.786, 1.000) and customize their individual display colors.
🔵 NOTES
Why this implementation is unique:
It merges classic Supertrend stop mechanics with both anchored OTE grids and continuous Fibonacci channel bands.
Features dynamic price proximity highlighting and custom linefill engines optimized for Pine Script version 6.
Provides extensive modular inputs for styling, level visibility, and operational mode switching.
インジケーター

Advanced Fibonacci Golden Zone [HexaTrades]Advanced Fibonacci Golden Zone automatically finds the market's significant swing legs and projects the Fibonacci Golden Zone, the 0.5 – 0.618 retracement pocket of the latest leg. That band is where trend-continuation entries are classically hunted. No manual fib drawing: the script detects the swing, anchors the retracement correctly for both directions, draws the zone the moment the swing confirms, manages the setup's whole lifecycle, and drives a duplicate-free alert stream.
⭐️How it works
True late-zone detection:
When a swing confirms, the script scans every bar from the actual pivot through the confirmation bar (wicks or closes, per Zone Touch Source). If the price has already reached the zone's near edge anywhere in that window, the zone is late and is skipped; no zone is ever painted behind a reaction that already happened. Strict rule: exactly touching the edge counts as late.
Superseded setups :
A skipped candidate retires the previously active setup immediately: status “Superseded”, zone frozen/faded, and total silence no false “Invalidated” alert (that one is reserved for setups price actually broke).
Invalidation frozen ATR buffer:
A setup dies when a bar closes beyond the protective swing by more than the Invalidation Buffer (× ATR). The buffer is measured once, at setup creation, and the invalidation price stays fixed for the setup's lifetime; later ATR changes can't move it. Dead zones gray out instantly and can never alert again; a broken leg is “poisoned” so its later extensions can't spawn a fresh setup.
Zone anchoring retracements vs projections
Bullish (up-leg): Retracement anchored at 0.0 at the high, 1.0 at the low → the 0.5–0.618 band sits below price as potential support.
Bearish (down-leg) : Mirror-anchored → the 0.5–0.618 band sits above the price as potential resistance.
Retracements (0–1.0) and continuation projections (1.272× / 1.618× of the impulse, beyond the extreme) are computed by separate functions and labelled separately projections are targets, not retracement ratios.
True late-zone detection :
When a swing confirms, the script scans every bar from the actual pivot through the confirmation bar (wicks or closes, per Zone Touch Source). If the price has already reached the zone's near edge anywhere in that window, the zone is late and is skipped; no zone is ever painted behind a reaction that already happened. Strict rule: exactly touching the edge counts as late.
Superseded setups:
A skipped candidate retires the previously active setup immediately: status “Superseded”, zone frozen/faded, and total silence no false “Invalidated” alert (that one is reserved for setups price actually broke).
Invalidation frozen ATR buffer:
A setup dies when a bar closes beyond the protective swing by more than the Invalidation Buffer (× ATR). The buffer is measured once, at setup creation, and the invalidation price stays fixed for the setup's lifetime; later ATR changes can't move it. Dead zones gray out instantly and can never alert again; a broken leg is “poisoned” so its later extensions can't spawn a fresh setup.
⭐️ Features
- Automatic Golden Zone (default 0.5 – 0.618, both ratios configurable)
- Optional fib levels: retracements 0 · 0.236 · 0.382 · 0.5 · 0.618 · 0.786 · 1.0 + separately labelled 1.272× / 1.618× projections
- ZigZag + HH / HL / LH / LL structure labels with live structure bias
- Historical zones stay frozen & softened; optional “One zone per leg” replaces same-leg drafts in place (off by default)
- Zone lifecycle: Waiting → Inside Zone → Rejected / Broke Out → Invalidated / Superseded dead zones gray out and go permanently silent
⭐️How to use it
- Wait for a fresh zone in the direction of the structure (HH+HL → longs, LH+LL → shorts).
- Let price come into the zone covered by the “Price Enters Golden Zone” .
- Look for the rejection: a candle that gets into the zone and closes back out in the trend direction.
- Targets & invalidation: Target 1 = the 0.0 level (the impulse extreme), Target 2 = the 1.272× projection, Target 3 = the 1.618× projection; status “Invalidated” (close beyond the protective swing + buffer) is the classical exit.
⭐️Alert
1 · Golden Zone Invalidated: close beyond the protective swing + frozen ATR buffer — kills the setup
2 · 1.618× Projection Reached: continuation target hit (also completes 1.272× if reached directly)
3 · 1.272× Projection Reached: continuation target hit
4 · Bullish / Bearish Rejection: candle gets into the zone, closes back out in trend direction (completes the entry latch too)
5 · Zone Breakout: price closes straight through the zone
6 · Price Enters Golden Zone: first touch of the zone
No zone-interaction alert can fire on the candle that creates a setup; signals are eligible from the following confirmed candle.
Bar-close confirmation is enforced in code (barstate.isconfirmed is part of every alert condition); alerts cannot trigger intrabar regardless of the frequency you pick. Still select “Once Per Bar Close”.
Advanced Fibonacci Golden Zone combines confirmed market structure, automatic Fibonacci mapping and complete setup management in one tool. It helps traders identify fresh retracement opportunities without manually drawing Fibonacci levels while keeping invalidation, projections and alerts consistent. Use it alongside trend context, price action and proper risk management—not as a standalone entry signal.
We would love to hear your suggestions. If you have ideas for new features, indicators, analytics, or improvements, please share your feedback. Your input helps guide future updates and improve the indicator for all traders.
Wedge pattern detector indicator is for educational and analytical purposes only. It is not financial advice. Trading involves risk. Always use proper risk management and combine this indicator with your own analysis before taking any trade.
インジケーター

Swing Fibonacci [BigBeluga]Swing Fibonacci is a high-precision geometric framework that merges traditional swing structure with parametric spiral projections. Unlike standard Fibonacci retracements that use static horizontal lines, this tool projects expanding harmonic spirals from major structural turning points to map out the "natural geometry" of the market.
By calculating the mathematical relationship between price volatility and time, the indicator identifies expansion shells where price is naturally inclined to react, stall, or reverse.
🔵 CONCEPTS
Macro Swing Detection: The engine utilizes a high-threshold lookback window (50–100 bars) to filter out market noise. It only identifies the most significant structural pivots, ensuring the spirals are anchored to "institutional" levels rather than minor retail fluctuations.
Anchor Points & Structural Mapping: At every confirmed trend reversal, the script anchors a ⦾ symbol. It then draws a solid "Swing Leg" connecting the current anchor to the previous one, providing a clear visual map of the market's structural transitions.
Parametric Fibonacci Spirals: The spirals are generated using a high-resolution 300-step parametric calculation. This ensures the curve remains perfectly smooth and mathematically accurate regardless of how many bars are on the screen.
Adaptive Price Normalization: To prevent the "squashed" look common in geometric tools, the spiral dynamically rescales itself based on the price range of the last 500 bars. This ensures the geometry stays proportional to current market volatility.
🔵 FEATURES
Institutional Data Dashboard: Located in the top-right corner, the dashboard provides real-time stats including the exact Anchor Price , the current Trend Status (BULLISH ▲ or BEARISH ▼), and the Swing % move from the low/high.
Real-Time Swing Tracking: A dynamic dashed line follows the current price, connecting it back to the active anchor point. This allows you to visualize the current "swing in progress" before it is finalized.
Parametric Control Suite:
• Radius: Adjusts the vertical "stretch" and overall size.
• Spiral Qty: Controls the number of rotations (up to 10) to project further into the future.
Color Flow Visualization: The spirals utilize a professional gradient transition from the bearish color (inner) to the bullish color (outer), visually representing the expansion of price energy.
🔵 HOW TO USE
Identify Reaction Zones: Price often treats the edges of the spiral curves as dynamic support and resistance. Look for "confluence" where a spiral curve intersects with a horizontal level or a previous swing point.
Forecasting Expansion:
• Bullish Spiral: Projects outward from a swing low, highlighting potential take-profit zones or areas where the trend might exhaust.
• Bearish Spiral: Projects from a swing high, identifying "expansion floors" for short positions.
Trend Confirmation: Use the Trend Squares at the bottom of the chart for a quick pulse on the current directional bias without cluttering the main price action.
Harmonic Timing: The spiral's horizontal reach provides a "time" component. If price reaches a specific spiral arc at a specific time, it often marks a high-probability turning point in the cycle.
🔵 CONCLUSION
Swing Fibonacci transforms abstract price action into a tangible geometric forecast. By anchoring dynamic, price-normalized spirals to the market’s strongest turning points, it provides a unique lens through which to view volatility, extension, and mean reversion.
Ideal for harmonic traders, swing analysts, and anyone looking for a deeper mathematical edge in their structural analysis. インジケーター

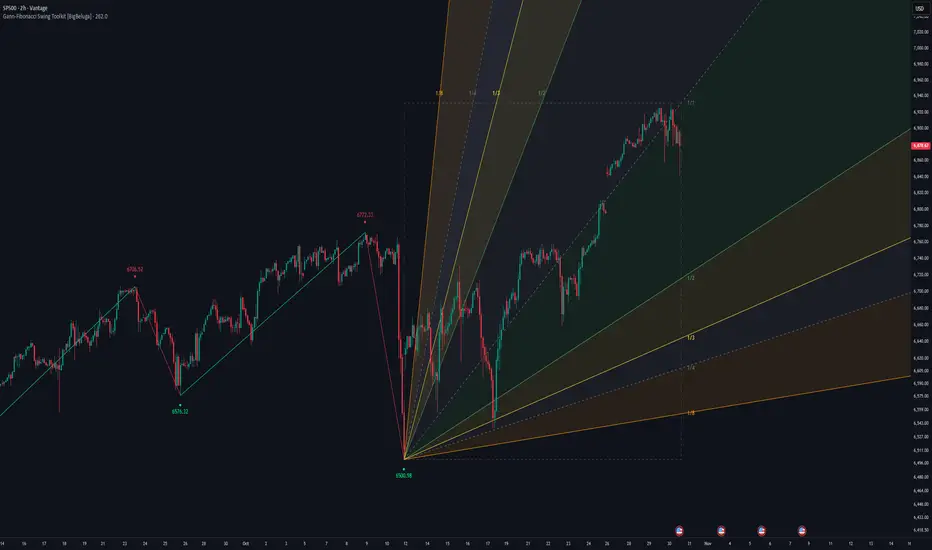
Gann-Fibonacci Swing Toolkit [BigBeluga]🔵 OVERVIEW
Gann–Fibonacci Swing Toolkit is an advanced swing-based projection tool that combines classic Gann geometry with Fibonacci ratios.
The indicator automatically detects market swings, anchors them to the most recent structure, and dynamically plots either Gann Fans or Gann Boxes to visualize price–time relationships, trend angles, retracement zones, and expansion targets.
This toolkit is designed to help traders understand not only where price may react, but also how fast it should move relative to time.
🔵 HISTORICAL BACKGROUND
The foundation of this toolkit comes from two of the most influential schools of market geometry:
W.D. Gann (early 1900s) introduced the idea that markets move according to geometric and mathematical laws, where price and time must stay in balance . His work emphasized angles (such as 1×1, 1×2, 1×3) that define how much price should advance or decline per unit of time.
Fibonacci ratios , derived from the Fibonacci sequence and popularized in trading decades later, describe natural proportional relationships observed across markets, especially during corrections and expansions.
Modern technical analysis merges these ideas by applying Fibonacci ratios to Gann’s price–time framework, creating tools that measure both distance (price) and duration (time) .
The Gann–Fibonacci Swing Toolkit follows this combined philosophy by grounding all projections in real swing structure rather than static or manually drawn anchors.
🔵 CORE CONCEPT
Swing-Based Anchoring — All calculations start from confirmed swing highs and lows detected via a rolling highest/lowest lookback.
Directional Context — The tool automatically determines bullish or bearish structure and adapts all projections accordingly.
Price–Time Geometry — Gann logic is applied by projecting price movement relative to elapsed bars, not just price distance.
🔵 KEY FEATURES
SWING DETECTION LOGIC
A swing high is confirmed when price forms a local maximum and then fails to extend higher.
A swing low is confirmed when price forms a local minimum and then fails to extend lower.
The most recent completed swing becomes the anchor point for all Gann and Fibonacci calculations.
Optional ZigZag lines visually connect completed swings for structural clarity.
GANN FAN MODE
When Fibonacci Type = Fan , the indicator plots dynamic Gann fan angles from the swing anchor.
Fan Ratios — Each fan line represents a 1/x (1/1, 1/2, 1/3, etc.), defining how much price should move per unit of time.
Trend-Aware Projection
- Bullish fans project upward from swing lows.
- Bearish fans project downward from swing highs.
Fan Fill Zones — Optional shaded regions between fan levels highlight price compression and expansion areas.
GANN BOX (FIBONACCI BOX) MODE
When Fibonacci Type = Box , the indicator builds a Gann Box using Fibonacci retracement and time ratios.
Horizontal Levels — Fibonacci price retracement levels (0.236, 0.382, 0.5, 0.618, 0.786) are projected from the swing range.
Vertical Levels — Fibonacci time divisions are applied across the swing duration to estimate timing of reactions.
Inverse Mode — Flips retracement logic to project inverted expansions instead of standard pullbacks.
OTE Zone — Optional Optimal Trade Entry zone highlights the premium/discount retracement area.
Dual-Axis Structure — Combines price and time into a single geometric framework instead of treating them separately.
MAIN FRAME LOGIC
A dynamic frame is drawn between the swing anchor and current bar, scaled by trend slope.
The frame visually represents the dominant trend channel derived from swing geometry.
VISUAL ELEMENTS
Swing anchor labels mark the exact price and bar index used for calculations.
Color-coded bullish and bearish swings improve structural readability.
Labels on fan and box levels display their exact Fibonacci ratios.
🔵 HOW TO USE
Use Gann Fans to trade dynamic trend support and resistance that evolves with time.
Use Gann Boxes to identify high-probability retracement zones and timing windows.
Combine fan angles with horizontal box levels for confluence-based entries.
Disable ZigZag if you want a cleaner chart focused only on projections.
🔵 CONCLUSION
Gann–Fibonacci Swing Toolkit is a geometry-driven market structure tool that goes beyond static Fibonacci levels.
By uniting Gann’s price–time balance with Fibonacci proportionality and anchoring everything to real swing structure, the indicator provides a deeper framework for understanding trend behavior, corrective depth, and future reaction zones — all derived directly from price action itself. インジケーター

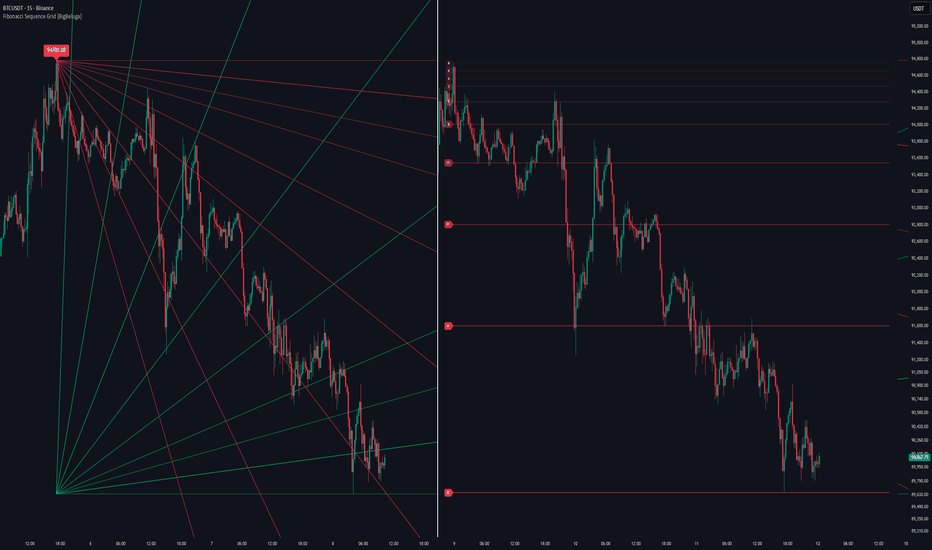
Fibonacci Sequence Grid [BigBeluga]🔵 OVERVIEW
A geometric price mapping tool that projects Fibonacci sequence levels and grid structures from recent price swings to help traders visualize natural expansion and reversion zones.
This indicator overlays Fibonacci-based structures directly on the chart, utilizing both grid projections and horizontal levels based on the classic Fibonacci integer sequence (0, 1, 1, 2, 3, 5, 8, ...). It identifies recent swing highs or lows and builds precision-aligned levels based on the trend direction.
🔵 CONCEPTS
Uses the Fibonacci integer sequence (not ratios) to define distances from the most recent swing point.
Identifies a trend based on EMA cross of fast and slow periods.
Projects two types of Fibonacci tools:
A grid projection from the swing point, displaying multiple sloped levels based on the sequence.
A set of horizontal Fibonacci levels for clean structural references.
Levels can be plotted from either swing low or high depending on the current trend direction.
Adjustable “Size” inputs control spacing between levels for better price alignment.
Lookback period defines how far the script searches for recent swing extremes.
🔵 FEATURES
Fibonacci Grid Projection:
Draws two mirrored Fibonacci grids—one expanding away from the swing high/low, the other converging toward price.
Swing-Based Trend Detection:
Uses a fast/slow EMA crossover to determine trend direction and reference swing points for projections.
Fibonacci Sequence Levels:
Displays horizontal levels based on the Fibonacci number sequence (0, 1, 2, 3, 5, 8, 13, 21...) for natural price targets.
Dynamic Labels and Coloring:
Each level is labeled with its sequence value and colored based on trend direction (e.g., red = downtrend, green = uptrend).
Both grids and levels can be toggled on/off independently.
Sizing controls allow tighter or looser clustering of levels depending on chart scale.
🔵 HOW TO USE
Enable Fibonacci Grid to visualize price expansion zones during impulsive trends.
Use Fibonacci Levels as horizontal support/resistance or target zones.
A label below price means the current trend is up and levels are projected from swing low.
A label above price means trend is down and levels are projected from swing high.
Adjust “Size” input to fit grid/level projection to your preferred chart scale or instrument volatility.
Use in confluence with price action, trend indicators, or volume tools for layered trading decisions.
🔵 CONCLUSION
Fibonacci Sequence Grid reimagines Fibonacci analysis using whole-number spacing from natural math progressions. Whether used for projecting grid-based expansions or horizontal support/resistance zones, it provides a powerful and intuitive structure to trade within. Perfect for traders who rely on symmetry, market geometry, and mathematically consistent levels. インジケーター
Fibonacci Projection with Volume & Delta Profile (Zeiierman)█ Overview
Fibonacci Projection with Volume & Delta Profile (Zeiierman) blends classic Fibonacci swing analysis with modern volume-flow reading to create a unified, projection-based market framework. The indicator automatically detects the latest swing high and swing low, builds a complete Fibonacci structure, and then projects future extension targets with clear visual pathways.
What makes this tool unique is the integration of two volume-based systems directly into the Fibonacci structure. A Fib-aligned Volume Profile shows how bullish and bearish volume accumulated inside the swing range, while a separate Delta Profile reveals the imbalance of buy–sell pressure inside each Fibonacci interval. Together, these elements transform the standard Fibonacci tool into a multi-dimensional structural and volume-flow map.
█ How It Works
The indicator first detects the most recent swing high and swing low using the Period setting. That swing defines the Fibonacci range, from which the script draws retracement levels (0.236–0.786) and builds a forward projection path using the chosen Projection Level and a 1.272 extension.
Along this path, it draws projection lines, target boxes, and percentage labels that show how far each projected leg extends relative to the previous one.
Inside the same swing range, the script builds a Fib-based Volume Profile by splitting price into rows and assigning each bar’s volume as bullish (close > open) or bearish (close ≤ open). On top of that, it calculates a Volume Delta Profile between each pair of fib levels, showing whether buyers or sellers dominated that band and how strong that imbalance was.
█ How to Use
This tool helps traders quickly understand market structure and where the price may be heading next. The projection engine shows the most likely future targets, highlights strong or weak legs in the move, and updates automatically whenever a new swing forms. This ensures you always see the most relevant and up-to-date projection path.
The Fib Volume Profile shows where volume supported the move and where it did not. Thick bullish buckets reveal zones where buyers stepped in aggressively, often becoming retestable support. Thick bearish buckets highlight zones of resistance or rejection, particularly useful if projected levels align with prior liquidity.
The Delta Profile adds a second dimension to volume reading by showing where buy–sell pressure was truly imbalanced. A projected Fibonacci target that aligns with a strong bullish delta, for example, may suggest continuation. A projection into a band dominated by bearish delta may warn of reversal or hesitation.
█ Settings
Period – bars used to determine swing high/low
Projection Level – chosen Fib ratio for projection path
-----------------
Disclaimer
The content provided in my scripts, indicators, ideas, algorithms, and systems is for educational and informational purposes only. It does not constitute financial advice, investment recommendations, or a solicitation to buy or sell any financial instruments. I will not accept liability for any loss or damage, including without limitation any loss of profit, which may arise directly or indirectly from the use of or reliance on such information.
All investments involve risk, and the past performance of a security, industry, sector, market, financial product, trading strategy, backtest, or individual's trading does not guarantee future results or returns. Investors are fully responsible for any investment decisions they make. Such decisions should be based solely on an evaluation of their financial circumstances, investment objectives, risk tolerance, and liquidity needs.
インジケーター

Automatic FibonacciFibonacci retracements are popular among technical traders. In technical analysis, a Fibonacci retracement is created by taking two extreme points (usually a peak and a trough) on a stock chart and dividing the vertical distance by the key Fibonacci ratios of 23.6%, 38.2%, 50%, 61.8%, and 100%. Basic fibo levels are often known to be 14.6%, 23.6%, 38.2%, 50%, 61.8%, 76.4%, 88.6% and 100%.
This indicator will draw the fibonacci levels automatically. Once these levels are identified, horizontal lines are drawn and used to identify possible support and resistance levels including zones. The fibo levels on this indicator gives you the option to use basic fibo or new paradigm fibo levels. New paradigm fibo levels may be new to most traders, however, the application of new paradigm fibo does allow one to trade with least risk due to the precision of the price action surrounding the fibo levels and zones.
One of the most efficient and great ways to apply this auto fibo indicator and the new paradigm fibo is by only leaving the fibo levels that do have hits and un-selecting the fibo levels that do not have any. You can further remove any other levels so you can trade the zones that these fibo levels create.
In addition, you can also switch the timeframe of the fibo from 1D to different number of days to 1W. インジケーター